Offering Type
Features
Categories
Search Results
Showing 369 results for ""

Ternary Plot
by LaDataViz
Plot three-part data on an triangle to reveal how each mark splits across three categories

Waterfall
by LaDataViz
Create beautiful and modern Waterfall charts with running totals, subtotals, and targets
KPI Card
by Eduard Nizamov
KPI cards with built-in trend charts and automatic period comparison.
DendroMap Explorer
by Eduard Nizamov
Interactive drill-down hierarchy tree visualization for Tableau dashboards.
FinanceTables
by Infotopics | Apps for Tableau
IBCS-ready financial reporting, directly in Tableau.

Spreadsheet
by DataMa
Interact with your data in an Spreadsheet environment, as if you were in Excel or Google Sheet!
Autom8
by Biztory
Trigger actions in any other app, from any dashboard. Autom8 connects Tableau to ... anything.

Tournament Bracket
by LaDataViz
Build stylish tournament-style bracket diagrams to follow the progression of your favorite team

Easy KPI Cards
by IP Faustov Aleksandr
Create beautiful, interactive KPI cards in Tableau — in seconds.
Gauge chart
by Infotopics | Apps for Tableau
Show one or many KPI gauges with radial, speedometer, or traffic-light layouts.
REST API Connector
by Tableau
The REST API Connector provides direct connectivity to RESTful APIs with Tableau.

Funnel Chart
by Infotopics | Apps for Tableau
Flexible funnel small multiples for stage progression, conversion, grouping, and target tracking.

Small Multiples
by Infotopics | Apps for Tableau
Repeat the same chart across panels to compare trends consistently and quickly.

Streamgraph
by Infotopics | Apps for Tableau
Show changing composition over time with flowing, stacked series around a centerline.

Calendar chart
by Infotopics | Apps for Tableau
Plot values by day in a calendar grid to reveal seasonality and temporal patterns.

Tree Diagram
by Infotopics | Apps for Tableau
Visualize hierarchical reporting structures with flexible layouts and node-level detail.
Sankey Diagram
by Infotopics | Apps for Tableau
Highly customizable Sankey Diagram to visualize flow of a measure across multiple dimensions.

Horizon Chart
by Infotopics | Apps for Tableau
Compress long time-series into compact bands for dense trend comparison.
Recursive Sankey Diagram
by Infotopics | Apps for Tableau
Visualizes the flow of a particular set of data from its origin to its destination.

Circular Sankey Diagram
by Infotopics | Apps for Tableau
Visualize the flow of a measure over multiple dimensions with internal loops.

Venn Diagram
by Infotopics | Apps for Tableau
A graphical representation used to illustrate the relationships between sets of data.

Waterfall Chart
by Infotopics | Apps for Tableau
A waterfall chart visually shows the cumulative effect of sequential changes on a starting value.

Radar Chart
by Infotopics | Apps for Tableau
A graphical method of displaying multivariate data in the form of a two-dimensional chart

Sunburst Diagram
by Infotopics | Apps for Tableau
Shows hierarchy through a series of rings, that are sliced for each category node.

Network Diagram
by Infotopics | Apps for Tableau
A highly customizable Network Diagram that allows users to understand relationships in data.

Chord Diagram
by Infotopics | Apps for Tableau
Illustrate the relationships and connections between entities in a network or system.

Zoomable Sunburst
by Infotopics | Apps for Tableau
A hierarchical visualization that represents data in a radial layout
SuperTables
by Infotopics | Apps for Tableau
Let users analyze and discover the data to support your visuals in stunning interactive tables.
DrillDownTree
by Infotopics | Apps for Tableau
Visualize and aggregate data across multiple dimensions - drill down in any order.
SuperTables
by Infotopics | Apps for Tableau
Let users analyze and discover the data to support your visuals in stunning interactive tables.
DrillDownTree
by Infotopics | Apps for Tableau
Visualize and aggregate data across multiple dimensions - drill down in any order.

HierarchyFilter
by Infotopics | Apps for Tableau
Replace multiple dashboard filters with one intuitive hierarchy filter.

PowerKPIs
by Infotopics | Apps for Tableau
Integrate strategic insights into your Tableau dashboards with PowerKPIs

Area Bump
by LaDataViz
Visualize how rankings and category dominance change over time
%20(1).png&w=256&q=75)
Dimensions & Metrics Explorer
by DataMa
This extension enables interactive KPI breakdowns with multi-dimensional, multi-metric views.
PowerKPIs
by Infotopics | Apps for Tableau
Integrate strategic insights into your Tableau dashboards with PowerKPIs

HierarchyFilter
by Infotopics | Apps for Tableau
Visualize flat or recursive data into a beautiful hierarchy filter.

HierarchyFilter
by Infotopics | Apps for Tableau
Replace multiple dashboard filters with one intuitive hierarchy filter.
AtScale
by AtScale
The Universal Semantic Layer for Enterprises.
Error Bars
by Actinvision
The Error Chart displays values and uncertainties to visualize deviations and confidence intervals.

Radial
by Tableau
Displays data in a circular format in which the total of all segment values add up to 100%.

Looker
by Google
Use a Looker Explore that is based on BigQuery as a data source in Tableau.

Line Chart
by LaDataViz
Create beautiful and modern Line charts with multiple styles (curves, area, gradients)

Sankey - Draggable
by LaDataViz
Create beautiful Sankey Diagrams and move the nodes around to create your perfect layout

Donut
by LaDataViz
Create a Donut chart without any hacks

Globe Path
by LaDataViz
Display animated arcs between origin and destination points on a 3D spinning globe

KPI Card (BANs)
by LaDataViz
Create a stunning KPI Card without any calculations in a single worksheet

Drill Down Filter
by LaDataViz
Add an advanced drop-down filter menu to your Dashboard in two minutes

Radial Sankey
by LaDataViz
Show the flow between sources and targets in an elegant Radial Sankey

Gauge
by LaDataViz
Create a fully customizable Gauge with a single drag-and-drop

Tree Diagram
by LaDataViz
Create beautiful radial, horizontal, or vertical Tree Diagrams

Streamgraph
by LaDataViz
Display time-series data with a beautiful and engaging Streamgraph

Network
by LaDataViz
Display complex relationships with our easy-to-use Network extension

Bump Chart
by LaDataViz
Easily track the ranking changes with a stunning Bump chart

Beeswarm
by LaDataViz
Show the distribution of your data with a Beeswarm chart

Radar
by LaDataViz
Compare performances with our beautiful Radat Chart extension

Chord
by LaDataViz
Easily visualize flow and connections with our Chord Diagram extension

Voronoi Treemap
by LaDataViz
Give a twist to the way you visualize hierarchical data with a Voronoi Treemap!
Date Picker
by Actinvision
Make it simple to focus on specific timeframes or compare different periods

Palantir Foundry
by Palantir
A Tableau Connector Plugin for Palantir Foundry
WriteBackExtreme
by Infotopics | Apps for Tableau
Create, Edit and Delete data directly from your Tableau Dashboards in a secure and governed way.
WriteBackExtreme Free
by Infotopics | Apps for Tableau
Collaborate directly from your Tableau Dashboards with WriteBackExtreme.
WriteBackExtreme Free
by Infotopics | Apps for Tableau
Collaborate directly from your Tableau Dashboards with WriteBackExtreme.
Nightingale+
by Actinvision
Visualisation circulaire qui met en évidence la magnitude relative des catégories
Eloqua (JDBC)
by Tableau
Tableau Connector to Eloqua over JDBC

Marketo (JDBC)
by Tableau
Tableau connector to Marketo over JDBC

Apache Impala
by Tableau
Tableau connector to open source Apache Impala over JDBC.

Apache Hive
by Tableau
Tableau connector to open source Apache Hive over JDBC.
Salesforce Commerce Cloud Intelligence
by Salesforce
B2C Commerce Intelligence Connector
Dr.Sum JDBC
by WingArc
JDBCを介したDr.SumへのTableauコネクタです。

Starburst
by Starburst
Starburst brings you fast, single point of access SQL queries for all your data sources.

Admin Insights Starter (English - United States)
by Tableau
Get more visibility into your Tableau Cloud deployment by using Admin Insights.

Disease Surveillance
by Tableau
Agency 360 disease surveillance monitoring
Admin Insights Starter (English - United Kingdom)
by Tableau
Get more visibility into your Tableau Cloud deployment by using Admin Insights.

StarRocks
by CelerData Inc
Tableau connector for StarRocks over JDBC

Assess Significance
by DataMa
Quickly assess the statistical significance of differences on any KPI between two points.
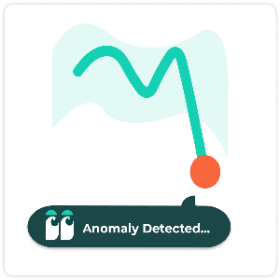
Anomaly Detection
by DataMa
Find anomalies in trend lines for multiple metrics and dimensions at the same time

CData Virtuality
by CData
Easily access live, governed data from all sources in Tableau—without complex prep or integration.

MongoDB SQL Interface
by MongoDB
Tableau Connector for the MongoDB SQL Interface to query live json-like document data.

Salesforce Data Cloud - Agent Operational Efficiency
by Tableau
Assess the operational efficiency of your AI agents
ClickHouse
by ClickHouse
Tableau connector to ClickHouse over JDBC.
MotherDuck / DuckDB
by MotherDuck
Simplified, performant and efficient data warehouse for the 95% of us that don’t need petabyte scale
Isotype
by Actinvision
Utilisez des images pour faire parler vos données

Marginal Histogram
by Infotopics | Apps for Tableau
Allow users to visualize both distributions and relationships between variables in a single view
Heatmap
by Actinvision
Les cartes de chaleur permettent de visualiser les données à travers les variations de couleur
DashPets
by Infotopics | Apps for Tableau
Transform data into a cute cat, happy dog, or cool T-Rex. Filter, interact, and have fun!

Salesforce Education Cloud - Academic Admissions Process
by Tableau
Assess your admissions process with data in Salesforce's Education Cloud data model.

Financial Performance Dashboard
by Mydral
Financial dashboard designed to assess an organization's financial health & operational performance

Tableau Pulse Adoption
by Tableau
Explore existing Pulse usage and uncover new Pulse opportunities

Tableau Table
by Tableau
Create a rich table experience with conditional formatting directly in Tableau.
Bullet
by Actinvision
L’extension ultra personnalisable pour graphiques à puces d’Actinvision

Polar Area / Nightingale
by LaDataViz
Compare dimensions beautifully with a Polar Area chart (also called Coxcomb or Nightingale Rose)
Salesforce Admin Insights
by Tableau
Sync to your Salesforce Org and get insights into your users.

Delta Sharing by Databricks
by Databricks
Tableau Connector to connect to Delta Sharing data by Databricks

IBM Informix
by Tableau
Connect to IBM Informix over JDBC

Salesforce Nonprofit Cloud - Grantmaking
by Tableau
Understand and inform your grantmaking process, allocation, and funding trends

StarTree Tableau Connector
by StarTree
Connect Tableau with StarTree for real-time dashboards and instant visual analysis and reporting.
Table
by Actinvision
Un affichage sous forme de table simple et efficace pour vos données.
Radar
by Actinvision
Un graphique en radar hautement personnalisable
Entonnoir
by Actinvision
Un graphique en entonnoir simple et personnalisable.
PictureThis Free
by Infotopics | Apps for Tableau
The Picture This extension helps you create dynamic image tables/cards based on your data.
ProcessMining Free
by Infotopics | Apps for Tableau
Visualize and analyze your processes based on log file extractions
Waterfall & KPI Tree: What's driving my variations?
by DataMa
Discover the WHY behind your KPIs variation with Datama for Tableau

Databricks Compute Cost Overview
by Tableau
Understand and control your Databricks account spend.

Data Source Manager for Tableau Cloud
by Tableau
Better explore, understand, and improve your data source management in Tableau Cloud

dbt Semantic Layer
by dbt Labs
Define metrics in code using the dbt Semantic Layer and access them seamlessly in Tableau.
PictureThis
by Infotopics | Apps for Tableau
The Picture This extension helps you create dynamic image tables/lists based on your data.
Sunburst (zoomable)
by Actinvision
The Sunburst Diagram is used to visualize hierarchical data using concentric circles.
Graphique radial
by Actinvision
Un graphique radial à barres affichés sur des plans à coordonnées polaires.

Write-Back
by Xpand IT
Turn your Tableau dashboards into collaboration hubs in minutes.
Vagaro Business Performance
by Vagaro
Understand performance of your business using your Vagaro bookings data

Tableau Dashboard Certification
by Wiiisdom
Deliver trust everyone can see! Dynamically certify dashboards to scale analytics governance.
Salesforce Data Cloud - Segmentation and Customer Insights
by Tableau
Assess your Customer Segmentation
GridPulse - Optimize the Heartbeat of Energy Consumption
by Slalom
Track energy consumption, costs, savings, & environmental impact for transparency

People Overview
by Tableau
First stop for executive leadership to learn about the makeup of their organizations
Actian JDBC
by Actian
Tableau Connector Plugin to Actian Data Platform, Vector, Actian X, and Ingres.

Merchant Analytics - Payment Provider
by USEReady
Identify trends revealing opportunities for growth & efficiency improvements

Merchant Analytics
by USEReady
Merchant Analytics Accelerator is designed for Banks, Payment Companies & their merchant customers

Sankey
by Tableau
Sankey Diagram is used to show the flow of data between multiple categories.

Accounts Payable
by Tableau
Manage and fulfill your short term financial obligations in a timely manner
Salesforce Data Cloud - Sales Pipeline
by Tableau
Sales Cloud: Conduct overall sales pipeline review

Real Estate Investment
by Tableau
Assess Performance of your Real Estate Investment

RFM Analysis
by Tableau
Revive your customer base (based on marketing actions suggested by an RFM analysis).

Sales Market Share
by Tableau
Compare your sales performance against competitors

Price Realization
by Tableau
Measure your ability to achieve the prices you set for your products or services in the market
.svg)
Sales
by Tableau
Assess & Improve your sales performance

Emergency Calls
by Tableau
Assess & Improve your efficiency in handling emergency calls

Weighted Sales Pipeline
by Tableau
Conduct overall sales pipeline review (opportunities having a probability of close)

Supply Intelligence
by Tableau
Gain a comprehensive and holistic view of your supply chain

NPS - Net Promoter Score
by Tableau
Understand how customers rate their experiences with your company

Shipment
by Tableau
Assess and improve your ability to deliver your customers on-time, in-full

Sales Pipeline
by Tableau
Conduct overall sales pipeline review

Donations
by Tableau
Acknowledge results of your fundraising efforts

Sales vs Quota
by Tableau
Assess your sales results vs quota

HR Expenses
by Tableau
Assess & monitor employee expenses
.svg)
Sales and Margin + Target
by Tableau
Assess & Improve your sales performance and profitability versus your target

Rooms Revenue
by Tableau
Hospitality: Assess & Develop your Rooms Revenue: RevPAR, ADR, OCC...

Business Travel (Hotel)
by Tableau
Assess & Optimize the volume of spend associated with hotel bookings

Business Travel (Air)
by Tableau
Assess & Optimize the volume of spend associated with air travel
.svg)
Sales and Margin
by Tableau
Assess & Improve your sales performance and profitability

Stock Coverage (ABC-XYZ)
by Tableau
Optimize the Stock Coverage of the items you hold in your inventory

Budget Controlling
by Tableau
Monitor, track, and manage financial performance and expenditures vs budget

Patient Record
by Tableau
Assess the overall efficiency of the facility to treat patients

Online Sales & Marketing
by Tableau
Assess your online sales performance & marketing profitability

Citizen Service Requests
by Tableau
Assess & Improve your ability to handle Citizen Service Requests

Income Statement (+Budget)
by Tableau
Assess your organization’s revenues, costs and overall profitability [Actual + Budget]

Production Scraps
by Tableau
Reduce the impact of scraps on your production line

Bank Cash Flow
by Tableau
Consolidate your cash positions across your bank accounts

Income Statement
by Tableau
Assess your organization’s revenues, costs and overall profitability [Actual only]

Likert Scale
by Tableau
Measure attitudes and opinions
.png&w=256&q=75)
Call Center
by Tableau
Assess & Improve the performance of your Call Center: Incoming Calls, FCR, CSAT...

Inventory
by Tableau
Manage your inventory more efficiently and more easily

Financial Statement
by Tableau
Assess the financial health of your organization: Income Statement & Balance Sheet

Service Desk
by Tableau
Assess & Improve the level of service of your Service Desk: overall and by agent group

Balance Sheet (+Budget)
by Tableau
Assess your organization’s financial position and stability [Actual + Budget]

Telco Calls
by Tableau
Assess the volume of activity you face: volume of calls, dropped calls, setup time, and handovers...
.png&w=256&q=75)
Occupational Health And Safety
by Tableau
Provide a safer workplace for workers

Telco - Account Development
by Tableau
Grow Monthly Recurring Charges (MRC), Reduce Churn Rate and Identify expansion opportunities

Headcount
by Tableau
Assess the number of employees you have
Insurance Claims
by Tableau
Assess your performance handling claims

Hospitality Finance
by Tableau
Assess your overall financial health across your properties: Revenues, Expenses, Profitability

Workforce
by Tableau
Assess the composition of your workforce. Measure and predict employee churn.

Recurring Revenue
by Tableau
Assess & Improve your Sales performance: Recurring Revenue & One-Time Fees

Retail Sales
by Tableau
Assess the performance of your network & grow your sales

Retail Crime
by Tableau
Track and reduce retail crime. Ensure safety for employees and customers.

Purchasing
by Tableau
Reduce Costs, minimize risks and determine savings automatically

Grant Allocation
by Tableau
Assess the allocation of grants: by program, by activity, by state

Spend Analytics
by Tableau
Assess & Monitor your volume of spend
Fraudulent Claims
by Tableau
Assess & Reduce your exposure to Fraudulent Claims

Risk Register
by Tableau
Assess your current exposure to risks

Project Portfolio
by Tableau
Evaluate your project portfolio: budget consumption, risk level, progress
Splunk
by Tableau
Connect to Splunk Enterprise over JDBC

Balance Sheet
by Tableau
Assess your organization’s financial position and stability [Actual only]
Salesforce Data Cloud - Customer Engagement
by Tableau
Assess Customer Engagement across channels: Sales, Email, Website, SMS, and Notifications.
Salesforce Data Cloud - Sales vs Quota
by Tableau
Assess your sales results vs quota
Salesforce Data Cloud - Sales
by Tableau
Assess & Improve your sales performance
Salesforce Data Cloud - Email Marketing Campaigns
by Tableau
Assess & Improve the efficiency of your marketing campaigns
Salesforce Data Cloud - Service Desk
by Tableau
Assess & Improve the level of service of your Service Desk: overall and by agent group
Salesforce Data Cloud - Weighted Sales Pipeline
by Tableau
Data Cloud: Conduct overall sales pipeline review (opportunities having a probability of close)

Salesforce Sales Cloud - Sales Pipeline
by Tableau
Sales Cloud: Conduct overall sales pipeline review

Accounts Receivable
by Tableau
Track, manage and collect payments from your debtors in a timely manner

Salesforce Nonprofit Cloud - Donations
by Tableau
Nonprofit Cloud: Acknowledge results of your fundraising efforts

Salesforce EDA - Academic Admissions Process
by Tableau
Assess your admissions process with data in Salesforce's Education Data Architecture (EDA) model.
Salesforce Sales Cloud - Weighted Sales Pipeline
by Tableau
Sales Cloud: Conduct overall sales pipeline review (opportunities having a probability of close)

Google Analytics
by Tableau
Assess & Improve your web site performance

Salesforce Service Cloud - Service Desk
by Tableau
Assess & Improve the level of service of your Service Desk: overall and by agent group
Salesforce Data Cloud - Identity Resolution
by Tableau
Monitor your processes of identity resolution in Data Cloud

Twitter Ads
by Tableau
Assess & Improve the performance of your marketing campaigns with Twitter Ads

Salesforce Nonprofit Cloud - Grant Management
by Tableau
Assess the allocation of grants: by program, by activity, by state

Salesforce Service Cloud - Voice Call
by Tableau
Assess & Improve the performance of your Call Center: Incoming Calls, FCR, CSAT...

Facebook Ads
by Tableau
Assess & Improve the performance of your marketing campaigns with Facebook Ads

Google Ads
by Tableau
Assess & Improve the performance of your marketing campaigns with Google Ads

Email Marketing Campaigns
by Tableau
Assess & Improve the efficiency of your marketing campaigns
Salesforce Data Cloud - Retail Sales
by Tableau
Assess the performance of your network & grow your sales

Salesforce Consumer Goods Cloud - Key Account Management
by Tableau
Monitor and improve your brands' performance in the marketplace

Academic Admissions
by Tableau
Assess where you are in your admissions process and how it has developed over the past few weeks

Trading
by Tableau
Assess and Improve your trading performance

Power Grid Connections
by Tableau
Assess & Improve your ability to handle requests related to Power Grid connections

ESG Benchmark
by Tableau
Assess how your organisation's ESG performance compares to industry peers

Client Assets, Liabilities & Profitability
by Tableau
Assess and improve the profitability of your client's assets & liabilities

Bank Income Statement
by Tableau
Assess the bank’s revenues, costs and overall profitability

AuM - Assets under Management
by Tableau
Assess your overall performance: Assets under Management & Net New Money

Assets under Management & Profitability
by Tableau
Assess your overall performance: Assets under Management & Profitability

Client Assets & Liabilities
by Tableau
Assess your overall performance: Assets under Management & Lending Stock

CEO Cockpit - Manufacturing
by Tableau
Monitor and optimize the overall performance of your organization (for Manufacturing)

Banking Loans
by Tableau
Assess your performance on loans: client liabilities, interests, amortization, revenue...

Denodo JDBC
by Denodo Technologies
Tableau Connector for Denodo that uses the JDBC driver.

AWS Cost Explorer
by Tableau
Monitor and optimize your AWS spend.

Amazon Neptune
by Amazon
The Amazon Neptune JDBC driver provides a SQL interface that allows access to Amazon Neptune.

Pixel Perfect
by USEReady
Pixel Perfect is a Tableau extension for print ready well formatted reporting.

Airline Revenue Accelerator
by USEReady
Analyze revenue factors. Improve decision-making. Enhance revenue.
Students at Risk Accelerator
by Datatelligent
Identifies students who may be at risk for not continuing school based on custom risk factors

Income Statement
by The Information Lab
Insights into financial performance of your firm in one view

Broker Portfolio Analytics
by The Information Lab
Explore and contrast how brokers have contributed to KPIs

Portfolio Performance for Wealth Managers
by The Information Lab
Insights into Portfolio and Client performance for Managers and Advisors.

Aceleración de Ventas
by Ennube
Analiza cuántas actividades se necesitan para cerrar una venta
Next Best Offer: Retail Banking
by Keyrus
Retail Banking dashboard providing product sales predictions & next best offer for the business
HR Diversity Scorecard
by Lovelytics
Get insights into the diversity of your organization—and employee satisfaction by cohort.

Investment Portfolio Performance
by Lovelytics
Insights into the financial performance of the companies in your investment portfolio

Executive KPI Scorecard
by Biztory
Analyze the critical data across your business in one scorecard

Tableau Cloud Migration Planner
by Zuar
Identify the content that does/does not need to be migrated to Tableau Cloud.
Customer Insights with Data Cloud
by Keyrus
Insights into customer performance by segment, demographic, and geography
Tableau Cloud Migration Technical Readiness Assessment
by Tableau
With just a few clicks, you can check if your Tableau Server is ready to migrate to Tableau Cloud.

Sales Acceleration
by Ennube
Analyze how many activities it takes to close a sale
Product Gaps & Risk Analysis
by Vivun
Use the Product Gaps & Risk Analysis accelerator to understand which of your deals may be at risk
.png&w=256&q=75)
Sales Performance
by Egen
Sales performance--and opportunities for improvement--across your organization
Team Member Activities
by Vivun
Use the Team Member Activities Accelerator to understand where your team is spending their time
.png&w=256&q=75)
Unified Customer Spend with Data Cloud
by Egen
Unified view of customers and their transaction history across various contact points
Funnel & Risk Analysis
by Vivun
Evaluate key metrics on how deals are performing & see historical perspective on deal lifecycle
Team Member Performance
by Vivun
Use the Team Member Performance Accelerator to understand how your team is performing

Tableau Cloud Migration Scope Evaluator
by USEReady
Expedite migration from Tableau on-prem to Tableau Cloud while automating steps in the framework

Salesforce Data Cloud Service Accelerator
by Atrium
Unify customer data to enable quick case resolution in Service Cloud & improve customer satisfaction

Salesforce Account Overview
by InterWorks
Insights into the industries and accounts that are generating revenue for your firm

Salesforce Campaigns
by InterWorks
Campaign performance and lead generation direct-connect to Salesforce

Plan Cloud Migrations with TabMove
by Biztory
Self-service estimator of level-of-effort to migrate to Tableau Cloud

Retail Store Performance
by InterWorks
Quickly see trends in customer behavior--and understand sales performance at a glance.

CampTag Taxonomy Auditor
by Decision Foundry
Find and fix errors in your Campaign taxonomy URLs quickly and easily.

Extension Summary Dashboard
by Decision Foundry
Introducing, for the first time, a dashboard based on Tableau Extension SDK.

Financial and Revenue Intelligence Toolkit
by Zuar
Support your revenue goals with the right inventory and organizational plans
Paid Media Analysis
by Keyrus
Find out which campaigns are creating new customers and ROI.
Supply Chain
by Keyrus
Insights into the health of your supply chain and its impact on your customers.

Tableau Server Usage
by The Information Lab
Who's using Tableau Server, and what's the most popular content?

Call Center Agent Analytics
by phData
Monitor the customer experience and call center agent performance

Sales Cloud Opportunities
by Biztory
What does your sales pipeline look like across teams and customers?
Salesforce Pipeline (direct connect)
by InterWorks
Insights into revenue, pipeline, and performance of sellers, with live data from Sales Cloud.

Health Data Interoperability Brickbuilder
by Lovelytics
Trends in care across your facilities and patient population

Emission Insights
by Devoteam
Track & analyze CO2 emissions relative to your reduction targets

Sales Pipeline
by Devoteam
Make data-driven decisions based on product and customer data
Profit Insights
by Devoteam
Product profitability and its impact on your business

Retail Sales Accelerator
by Globant
The Retail Sales Accelerator provides valuable info for sales analysis & operational optimization.
Salesforce Pipeline
by InterWorks
Insights into revenue, pipeline, and performance of sellers
.png&w=256&q=75)
Synchronized Refresh
by phData
Synchronizes dashboard refreshes for all users so you can collaborate in real time on the same data.

Warranty Claims Analytics
by Wipro
Identify potential auto warranty fraud
.png&w=256&q=75)
Sales, Customer, and Product Performance
by phData
Insights into sales, customer, and product performance show you how your business is performing
.png&w=256&q=75)
Google Ad Spend and Campaign Performance
by phData
Insights into ROI on Google ad spend and campaign performance

Revenue Operations
by Atrium
Understand customer risk and take action to ensure achievement of growth targets.
%20-%20Greta%20Pela%C3%8C%C2%80.png&w=256&q=75)
Sales Pipeline and Forecast
by Visualitics
Make business-critical decisions with analytics driven by Sales Cloud

Customer Demographics
by Beinex
Demographics of your customers and the services that they consume

Gaming Analytics
by Lovelytics
Investigate your gaming data against goals and KPIs

Jira
by Tableau
Connect to Jira via JDBC
Tableau Connector for ServiceNow
by Tableau
Connect to ServiceNow via JDBC
.png&w=256&q=75)
SuperKPIs Income Statement
by Infotopics | Apps for Tableau
Present your P&L data in a visual way. Compare P&L positions to budget and prior year!
Amazon S3
by Tableau
See and understand data from your Amazon S3 buckets in Tableau.

Project Pipeline Planning
by Moyo
Provide insights on the cost and expected benefits of planned projects

Budget Allocation
by Beinex
Revenue, expenses, and budget management

Snowflake Account Usage
by Tableau
Track your usage, costs, and performance of your Snowflake account

SingleStoreDB JDBC
by Singlestore
Visualize and analyze your SingleStoreDB data in real-time.
.png&w=256&q=75)
Ocient JDBC
by Ocient
Ocient DB provides Real-Time Relational Analytics on Datasets larger than 10 petabyte or beyond

Sales Performance
by Knowit
Insights into the revenue performance of your company
Kinetica Geospatial Analytics
by Kinetica
Analyze billions of points, lines & polygons on a map with Kinetica database server-side rendering.

Customer Cohort Analysis
by Biztory
Customer acquisition and retention trends and opportunities
.png&w=256&q=75)
Dashboard Load Times - Tableau Cloud
by Tableau
Monitor and drive improvements in Tableau dashboard load times
Gender Representation in the Workplace
by Slalom UK
How diverse is your workplace, and how do salaries differ by gender?

Project Management Overview
by Merkle
Insights into project budget, performance and timelines.

OpenSearch
by Amazon
The OpenSearch Project JDBC driver provides a SQL interface that allows access to OpenSearch

Nonprofit Fundraising & Marketing KPI's (Spreadsheet)
by Tableau
Unlock Fundraising and Marketing KPI's

Climate Change Portfolio Risk
by USEReady
Make better decisions for your investments portfolio based on climate change projections

Hotel Revenue Performance
by Lovelytics
Quickly setup, monitor, and analyze common metrics for hotel performance

Client-facing Wealth Management Analytics
by Lovelytics
Enable clients to monitor key portfolio metrics

Runaway Queries on Snowflake
by CoEnterprise
Quick insights into runaway queries in Snowflake with available Slack integration
%20-%20Greta%20Pela%C3%8C%C2%80.png&w=256&q=75)
Google Analytics Accelerator
by Visualitics
Insights into customer engagement with your website
Quality Care Analytics
by InterWorks
Analyses the results of Care Quality Commission audits of healthcare settings in the UK.
Climate Impact
by Merkle
Manage your carbon footprint to identify areas for improvement and work towards net zero

Design Auditor (Professional Services required)
by Tableau
Grade Tableau dashboards against performance best practices to drive improvements in load times.

Dashboard Load Times
by Tableau
Monitor and drive improvements in Tableau dashboard load times
Non-Profit Donations
by Keyrus
Insights into fundraising performance and donor retention

Financial Advisor Outreach Performance
by USEReady
Customer Outreach performance metrics for Fund Advisors

Sharepoint Lists (JDBC)
by Tableau
Tableau Connector to Sharepoint Lists over JDBC

Motor Vehicle Incident & Crash Metrics
by Tableau
Insights into car crash incidences and public services responsiveness

Insurance Underwriter Scorecard
by CoEnterprise
Evaluate underwriter efficiency, improve cycle time, and reduce costs.

Child Welfare Intelligence
by Tableau
Monitor and analyze child welfare cases and incidents

Cannabis Inspections
by Tableau
Insights into inspections across all areas of cannabis production

Product Sales Performance with Shopify
by Lovelytics
Analyze your product performance and customer behavior with Shopify data
Equipment Productivity
by Keyrus
Find out how productive your facility—and the people operating it—are.
InstantAnalytics for Marketing
by Lovelytics
Insights into marketing content performance and ROI

Absence Management
by The Information Lab
Insights into employee absences and causes for unplanned leave across your business.

Exasol JDBC
by Exasol
Enable Tableau access to an Exasol database via JDBC

Salesforce Marketing Cloud
by Tableau
Tableau connector to Salesforce Marketing Cloud.

Fraud, Waste, and Abuse
by AVAAP
Monitor and predict fraudulent submissions for claims benefits

Productive Maintenance
by Tableau
Monitor equipment performance and resolve problems

Customer Support Package Trends
by The Information Lab
Discover customer support package trends and up-sell customers to ensure satisfaction

Contract Renewals Overview
by The Information Lab
Identify at-risk renewals and prevent customer churn
Recruiting Efficiency
by InterWorks
Examines recruiting efficiency by analyzing the time to fill open positions.
Energy Spot Price
by InterWorks
Enables energy companies to make sales decisions based on current demand and pricing
Energy Production Scorecard
by InterWorks
Provides insights into energy generation by source
Add Filters Extension
by Tableau
Add Filters offers customized dashboards by showing/hiding filters, parameters, pages, & sheets

Insurance Underwriter Performance
by The Information Lab
Comparison and benchmarking of underwriters across a series of customizable key metrics

Consumer Website Behavior
by The Information Lab
Understand customer browsing and purchasing behavior by point of entry

Insurance KPI Overview
by The Information Lab
Monitor multiple insurance-related KPIs and track changes over time

Return Fraud Monitoring
by Cleartelligence
Monitors retail organization's returns for fraud

Executive KPIs
by Cleartelligence
Actionable KPIs for executives and finance leaders

Salesforce Manufacturing Cloud Rebates What-If
by Tableau
What-If Analysis for Rebates Management
Workforce Planning
by Billigence
Find out quickly how your workforce--and salary expenditures--are changing.
Firebolt
by Firebolt Analytics Inc
Firebolt is the cloud data warehouse for next-gen analytics experiences.
ESG Impact Tracking
by Slalom
Understand your organization's environmental and social impacts.
Sustainable Supply Chain
by Slalom
This Accelerator shows you how sustainable your supply chain is--and whether it's meeting goals.

Salesforce Net Zero Cloud What-If
by Tableau
What-If Planning for NZC
DreamTeams
by Infotopics | Apps for Tableau
Close the loop and collaborate immediately from your Tableau dashboard in Microsoft Teams!
Couchbase Analytics
by Couchbase Analytics
The Couchbase Analytics Tableau Connector enables visual operational data against JSON data

Salesforce Education Cloud IPEDS Accelerator
by Tableau
Turn your student and support staff data into actionable insights.
ShowMeMore 2.0
by Infotopics | Apps for Tableau
Add new visualization types like the Sankey Diagram and Radar Chart to your Tableau Dashboards.
Custom Logo
by Biztory
Dynamically display an image/logo based on the values in your data, customizing your dashboard.
Next Dashboard
by Biztory
Automatically forwards the user's browser to the next configured dashboard after a certain delay.

Salesforce Education Cloud Student Success Hub
by Tableau
Turn your student and support staff data into actionable insights.

Salesforce Education Cloud Admissions Connect
by Tableau
Turn your recruiting and admissions data into actionable insights.

Salesforce Education Cloud Office of the President
by Tableau
Create a diverse and inclusive campus that fosters innovation and collaboration.

Altinity Connector for ClickHouse
by Altinity Inc
Enable Tableau access to ClickHouse data via ODBC.

Salesforce Open Pipeline
by Tableau
Shows pipeline stages so you can identify possible leakages in sales cycles.

Salesforce Opportunity Tracking
by Tableau
Monitors upcoming opportunities and shows those closing in the near future.

Executive Dashboard
by Tableau
Provides an overview of all incidents, problems, and requests. With key metrics such as year-over-year trends, ov...

Salesforce Opportunity Overview
by Tableau
Tracks sales distribution and win rate of opportunities by location, or industry, and close date.

Problem Tracker for IT Staff
by Tableau
Lets you track active problems and prioritize your efforts. Breaks down problems by opened and last-updated dates...

Product Utilization
by Tableau
Tracks seat usage and daily trend of user activities. With inactive days broken down by each team member, you can...

Account Engagement
by Tableau
Provides engagement metrics for all accounts targeted in current campaigns. Reveals interest level for each accou...

Campaign Details
by Tableau
Lets you dive into detailed metrics for each email campaign to analyze performance. Shows the funnel of emails se...

Salesforce Case Tracking
by Tableau
The Case Tracking dashboard allows you to visualize cases.

Salesforce Marketing Leads
by Tableau
Analyzes lead generation and conversion rates by geography, source, and industry.

Salesforce Nonprofit Program Management
by Tableau
Gain meaningful insights into your program data.

Performance Overview
by Tableau
Provides an overview of Social Selling Index (SSI), profile searches, lead saving, and InMail response rate acros...

Campaign Overview
by Tableau
Shows activity for all current email campaigns, helping you see overall campaign performance. Provides key metric...

Email Performance by Campaign
by Tableau
Lets you analyze the performance of each email campaign. Shows the funnel of emails sent, delivered, opened, and ...

Salesforce Nonprofit Case Management
by Tableau
Gain meaningful insights into your program and client data.

Salesforce Account Tracking
by Tableau
Tracks the performance of your accounts.

Target Search
by Tableau
Deep dives into profile search activities of your teams. Correlates profiles viewed and searches performed to rev...

SSI Analysis
by Tableau
Tracks Social Selling Index (SSI) score changes over a time period and in each pillar. You can filter by name to ...

Salesforce Nonprofit Fundraising
by Tableau
Unlock the power of fundraising data.

Request Report for IT Managers
by Tableau
Gives you an overview of all requests opened in a month. Shows the distribution of requests by weekday, category,...

InMail Engagement
by Tableau
Measures your teams’ effectiveness in using InMail to engage potential customers. Tracks response rate by date, t...

Problem Report for IT Managers
by Tableau
Provides an overview of all problems opened in a month. Shows the distribution of problems by open time, assignme...

Salesforce Top Accounts
by Tableau
Tracks the performance of top accounts.

Email Performance Overview
by Tableau
Provides activity metrics for all current email programs, helping you see overall performance. Includes key email...
Let's Annotate
by Starschema
Custom annotations for your Tableau Dashboards. Leverages React Annotation.

SAP SuccessFactors
by Tableau
Tableau connector to SAP SuccessFactors over JDBC.

Oracle NetSuite
by Tableau
Tableau connector to NetSuite CRM and ERP over JDBC.

Jethro ODBC
by Jethro Data
Accelerate Tableau's performance with Jethro's indexing and auto aggregations.
BI Connector
by Guidanz Inc
Connect Tableau to OBIEE (and OAC, OAS) and experience hassle-free data visualization.
%20(3).png&w=256&q=75)
Rockset
by Rockset, Inc.
Create real-time Tableau dashboards with data from Kafka, Spark, DynamoDB, MongoDB and more.

Google Analytics 4
by Tableau
Tableau connector to Google Analytics 4 properties.
Compare - Smart Waterfall
by DataMa
Dynamic waterfall to automate gap analysis. Augmented analysis for any variation explanation
Stratio Crossdata
by Stratio BD
Stratio Crossdata data virtualizer powered by Apache Spark.

Actian ODBC
by Actian
Tableau Connector Plugin to Actian Avalanche, Vector, ActianX, and Ingres.
ProcessMining
by Infotopics | Apps for Tableau
Visualize and analyze your processes based on log file extractions

Write-Back Server
by Xpand IT
Allow users to input data, like forecasting, planning, adding comments or any actionable process.
Image Map Filter
by Tableau
Create a more interactive experience with a custom image map to filter your dashboards.
PerformanceInsight
by Infotopics | Apps for Tableau
Measure your Dashboard performance and receive expert advice on performance improvements.
Single Checkbox Parameters
by Tableau
This extension allows you to have a single checkbox that can toggle between two values.
ScrollyTelling
by Infotopics | Apps for Tableau
Next level storytelling in Tableau. Your story unfolds when you scroll your dashboard.
Write-Back Form Builder
by M2
Design interactive data entry masks for custom database write-back in Tableau dashboards.

Write-Back Free
by Xpand IT
Write-back allows you to select data from your sheets, add new information to it and persist it.