Visualisatie-uitbreidingen
Functies
Alle Visualisatie-uitbreidingen

Sankey
door Tableau
Een Sankey-diagram wordt gebruikt om de dataflow tussen meerdere categorieën weer te geven.

Tableau Table
door Tableau
Maak rich text-tabellen met voorwaardelijke opmaak, rechtstreeks in Tableau.

Radial
door Tableau
Displays data in a circular format in which the total of all segment values add up to 100%.

Donut
door LaDataViz
Maak een donutdiagram zonder hacks

Tree Diagram
door LaDataViz
Maak prachtige radiale, horizontale of verticale boomdiagrammen

Gauge
door LaDataViz
Maak met één drag-and-drop actie een volledig aanpasbaar meterdiagram
SuperTables
door Infotopics | Apps for Tableau
Laat gebruikers de data analyseren en verkennen die uw visuals ondersteunen in prachtige interactieve tabellen.

Radar Chart
door Infotopics | Apps for Tableau
Een grafische methode om multivariate data weer te geven in de vorm van een tweedimensionale grafiek
PowerKPIs
door Infotopics | Apps for Tableau
Integrieren Sie mit PowerKPIs strategische Erkenntnisse in Ihre Tableau Dashboards

Waterfall Chart
door Infotopics | Apps for Tableau
Een watervalgrafiek toont visueel het cumulatieve effect van opeenvolgende wijzigingen op een beginwaarde.

KPI Card (BANs)
door LaDataViz
Maak een prachtige KPI-kaart zonder berekeningen in één werkblad
Sankey Diagram
door Infotopics | Apps for Tableau
Zeer aanpasbaar Sankey-diagram om de flow van een meetwaarde over meerdere dimensies te visualiseren.

Radar
door LaDataViz
Vergelijk prestaties met onze prachtige radardiagramuitbreiding

Streamgraph
door LaDataViz
Geef tijdreeksdata weer in een prachtige, aansprekende stroomgrafiek
DrillDownTree
door Infotopics | Apps for Tableau
Visualiseer en aggregeer data over meerdere dimensies - geef meer details weer in willekeurige volgorde.

Zoomable Sunburst
door Infotopics | Apps for Tableau
Een hiërarchische visualisatie die data weergeeft in een radiale lay-out

Polar Area / Nightingale
door LaDataViz
Vergelijk dimensies op een fraaie manier met een polair vlakdiagram (ook wel Coxcomb of Nightingale Rose genoemd)
Zonnestraal (zoombaar)
door Actinvision
De zonnestraalgrafiek wordt gebruikt om hiërarchische data te visualiseren met behulp van concentrische cirkels.

Network Diagram
door Infotopics | Apps for Tableau
Een zeer aanpasbaar netwerkdiagram waarmee gebruikers relaties in data kunnen begrijpen.

Beeswarm
door LaDataViz
Maak de distributie van uw data duidelijk met een bijenzwermgrafiek
Heatmap
door Actinvision
Heatmaps visualiseren gegevens door variaties in kleuren

Network
door LaDataViz
Geef complexe relaties weer met onze gebruiksvriendelijke netwerkuitbreiding

Venn Diagram
door Infotopics | Apps for Tableau
Een grafische voorstelling die wordt gebruikt om de relaties tussen reeksen data te illustreren.

Line Chart
door LaDataViz
Maak prachtige, moderne lijndiagramman met meerdere stijlen (curven, vlakken, kleurovergangen)
Radar
door Actinvision
Een zeer aanpasbaar radardiagram

Sankey - Draggable
door LaDataViz
Maak prachtige Sankey-diagrammen en verplaats de knooppunten zodat u precies de goede lay-out krijgt.
Trechter
door Actinvision
Een eenvoudig en aanpasbaar trechterdiagram.

Sunburst Diagram
door Infotopics | Apps for Tableau
Toont hiërarchie door middel van een reeks ringen, die voor elk categorieknooppunt worden gesneden.

Voronoi Treemap
door LaDataViz
Gebruik een Voronoi-treemap om een draai te geven aan de manier waarop u hiërarchische data visualiseert.
Radiale grafiek
door Actinvision
Een radiale grafiek verwijst eenvoudigweg naar staafdiagrammen die worden weergegeven op polaire coördinaatvlakken.
Recursive Sankey Diagram
door Infotopics | Apps for Tableau
Visualiseert de stroom van een bepaalde set data van de oorsprong naar de bestemming.
DashPets
door Infotopics | Apps for Tableau
Zet data om in een leuke kat, blije hond of gave t-rex. Filter, speel en maak plezier!

Bump Chart
door LaDataViz
Houd wijzigingen in een rangschikking gemakkelijk bij met een prachtige hobbelgrafiek

Radial Sankey
door LaDataViz
Toon de flow tussen bronnen en doelen in een elegant radiaal Sankey-diagram

Chord Diagram
door Infotopics | Apps for Tableau
De relaties en verbindingen tussen entiteiten in een netwerk of systeem illustreren.
PictureThis Free
door Infotopics | Apps for Tableau
Met de Picture This-uitbreiding kunt u dynamische afbeeldingsbestanden of kaarten maken op basis van uw data.

Drill Down Filter
door LaDataViz
Voeg binnen twee minuten een geavanceerd vervolgkeuzefiltermenu toe aan uw dashboard

Chord
door LaDataViz
Visualiseer gemakkelijk flows en verbindingen met onze akkoorddiagramuitbreiding
Waterfall & KPI Tree: What's driving my variations?
door DataMa
Ontdek het WAAROM achter uw KPI's variatie met Datama voor Tableau
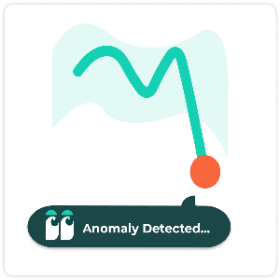
Anomaly Detection
door DataMa
Zoek naar anomalieën in trendlijnen voor meerdere statistieken en dimensies tegelijkertijd

Globe Path
door LaDataViz
Geef geanimeerde bogen tussen oorsprong en bestemming weer op een draaiende 3D-wereldbol.

Circular Sankey Diagram
door Infotopics | Apps for Tableau
Visualiseer de flow van een meetwaarde over meerdere dimensies met interne lussen.
Tabel
door Actinvision
Un affichage sous forme de table simple et efficace pour vos données.

Marginal Histogram
door Infotopics | Apps for Tableau
Laat gebruikers distributies en relaties tussen variabelen visualiseren in één weergave

Assess Significance
door DataMa
Beoordeel direct de statistische significantie van verschillen voor elke KPI tussen twee punten.
ProcessMining Free
door Infotopics | Apps for Tableau
Visualiseer en analyseer uw processen op basis van extracties van logbestanden
Bullet
door Actinvision
De ultra-aanpasbare puntengrafiekuitbreiding van Actinvision

Funnel Chart
door Infotopics | Apps for Tableau
Flexible funnel small multiples for stage progression, conversion, grouping, and target tracking.
WriteBackExtreme Free
door Infotopics | Apps for Tableau
Werk direct samen vanuit uw Tableau-dashboards met WriteBackExtreme.
Gauge chart
door Infotopics | Apps for Tableau
Show one or many KPI gauges with radial, speedometer, or traffic-light layouts.

Easy KPI Cards
door IP Faustov Aleksandr
Create beautiful, interactive KPI cards in Tableau — in seconds.

Calendar chart
door Infotopics | Apps for Tableau
Plot values by day in a calendar grid to reveal seasonality and temporal patterns.

Tree Diagram
door Infotopics | Apps for Tableau
Visualize hierarchical reporting structures with flexible layouts and node-level detail.

Small Multiples
door Infotopics | Apps for Tableau
Repeat the same chart across panels to compare trends consistently and quickly.

Area Bump
door LaDataViz
Visualize how rankings and category dominance change over time
Isotype
door Actinvision
Afbeeldingen gebruiken om het verhaal van uw data te vertellen

HierarchyFilter
door Infotopics | Apps for Tableau
Replace multiple dashboard filters with one intuitive hierarchy filter.
Date Picker
door Actinvision
Maak het eenvoudig om u op specifieke tijdsbestekken te concentreren of om verschillende perioden te vergelijken
Nightingale+
door Actinvision
De Nightingale-uitbreiding is een cirkelvormige visualisatie waarmee de relatieve omvang van categorieën wordt ge...

Streamgraph
door Infotopics | Apps for Tableau
Show changing composition over time with flowing, stacked series around a centerline.

Horizon Chart
door Infotopics | Apps for Tableau
Compress long time-series into compact bands for dense trend comparison.
%20(1).png&w=256&q=75)
Dimensions & Metrics Explorer
door DataMa
This extension enables interactive KPI breakdowns with multi-dimensional, multi-metric views.

Tournament Bracket
door LaDataViz
Build stylish tournament-style bracket diagrams to follow the progression of your favorite team

Spreadsheet
door DataMa
Interact with your data in an Spreadsheet environment, as if you were in Excel or Google Sheet!
KPI Card
door Eduard Nizamov
KPI cards with built-in trend charts and automatic period comparison.

HierarchyFilter
door Infotopics | Apps for Tableau
Replace multiple dashboard filters with one intuitive hierarchy filter.
Error Bars
door Actinvision
The Error Chart displays values and uncertainties to visualize deviations and confidence intervals.
FinanceTables
door Infotopics | Apps for Tableau
IBCS-ready financial reporting, directly in Tableau.

Waterfall
door LaDataViz
Create beautiful and modern Waterfall charts with running totals, subtotals, and targets

Ternary Plot
door LaDataViz
Plot three-part data on an triangle to reveal how each mark splits across three categories