Extensiones de visualizaciones
Funcionalidades
Todo: Extensiones de visualizaciones

Sankey
por Tableau
El diagrama de Sankey se utiliza para mostrar el flujo de datos entre varias categorías.

Tableau Table
por Tableau
Cree una experiencia de tabla sin igual con formato condicional directamente desde Tableau.

Radial
por Tableau
Displays data in a circular format in which the total of all segment values add up to 100%.

Donut
por LaDataViz
Cree un gráfico de donut sin esfuerzo

Tree Diagram
por LaDataViz
Cree atractivos diagramas de árbol radiales, horizontales o verticales

Gauge
por LaDataViz
Cree un gráfico de velocímetro personalizable con solo arrastrar y soltar
SuperTables
por Infotopics | Apps for Tableau
Permita que los usuarios analicen y descubran los datos que pueden complementar sus elementos visuales en tablas ...

Radar Chart
por Infotopics | Apps for Tableau
Un método gráfico de mostrar datos multivariante en la forma de un gráfico de dos dimensiones
PowerKPIs
por Infotopics | Apps for Tableau
Integrieren Sie mit PowerKPIs strategische Erkenntnisse in Ihre Tableau Dashboards

Waterfall Chart
por Infotopics | Apps for Tableau
Un gráfico de cascada muestra el efecto acumulado de cambios secuenciales a partir de un valor inicial.

KPI Card (BANs)
por LaDataViz
Cree una Tarjeta KPI sin cálculos en una sola hoja de trabajo
Sankey Diagram
por Infotopics | Apps for Tableau
El diagrama de Sankey se puede personalizar en detalle y ayuda a visualizar el flujo de una medida en diferentes...

Radar
por LaDataViz
Compare rendimientos con nuestra extensión Radar Chart

Streamgraph
por LaDataViz
Muestre datos históricos con un gráfico de flujo atractivo y completo
DrillDownTree
por Infotopics | Apps for Tableau
Vea y agregue datos en diferentes dimensiones y desglóselas en el orden que quiera.

Zoomable Sunburst
por Infotopics | Apps for Tableau
Una visualización jerárquica que representa los datos en un diseño radial

Polar Area / Nightingale
por LaDataViz
Compare dimensiones de manera atractiva con un gráfico de área polar (también llamados Coxcomb o rosa Nightingale)
Sunburst (Zoomable)
por Actinvision
El diagrama solar se usa para visualizar datos jerárquicos usando círculos concéntricos.

Network Diagram
por Infotopics | Apps for Tableau
Un diagrama de red muy personalizable que permite a los usuarios comprender las relaciones entre sus datos.

Beeswarm
por LaDataViz
Muestre la distribución de sus datos con un gráfico de enjambre
Heatmap
por Actinvision
Los mapas de calor muestran variaciones de datos a través de diferentes colores

Network
por LaDataViz
Muestre relaciones complejas con nuestra extensión Network fácil de usar

Line Chart
por LaDataViz
Cree gráficos de líneas atractivos y modernos con varios estilos (curvas, área y degradados)

Venn Diagram
por Infotopics | Apps for Tableau
Un representación gráfica usada para ilustrar las relaciones entre diferentes conjuntos de datos.
Radar
por Actinvision
Un gráfico de radar personalizable

Sankey - Draggable
por LaDataViz
Cree diagramas de Sankey atractivos y mueva los nodos para crear un diseño perfecto
Embudo
por Actinvision
Un gráfico de embudo sencillo y personalizable.

Sunburst Diagram
por Infotopics | Apps for Tableau
Muestra la jerarquía a través de una serie de anillos que se dividen para cada nodo de categoría.

Voronoi Treemap
por LaDataViz
Revolucione su forma de ver datos jerárquicos con un diagrama de árbol de Voronoi.
Recursive Sankey Diagram
por Infotopics | Apps for Tableau
Visualiza el flujo de un conjunto concreto de datos desde su origen hasta su destino.
Gráfico radial
por Actinvision
Un gráfico radial es un gráfico de barras que se muestra en planos de coordenadas polares.
DashPets
por Infotopics | Apps for Tableau
Transforme sus datos en un lindo gatito, en un perro contento o en un fantástico T-Rex. ¡Filtre, interactúe y div...

Bump Chart
por LaDataViz
Registre fácilmente los cambios en las clasificaciones con un gráfico bump chart

Radial Sankey
por LaDataViz
Muestre el flujo entre orígenes y destinos en un diagrama de Sankey elegante

Chord Diagram
por Infotopics | Apps for Tableau
Ilustre las relaciones y conexiones entre entidades dentro de una red o un sistema.
PictureThis Free
por Infotopics | Apps for Tableau
La extensión Picture This le ayuda a crear tablas/tarjetas de imágenes dinámicas basadas en sus datos.

Drill Down Filter
por LaDataViz
Agregue un menú de filtro desplegable avanzado a su dashboard en un par de minutos

Chord
por LaDataViz
Visualiza el flujo y las conexiones fácilmente con nuestra extensión Chord Diagram
Waterfall & KPI Tree: What's driving my variations?
por DataMa
Descubra los motivos de los cambios en sus KPI con Datama para Tableau
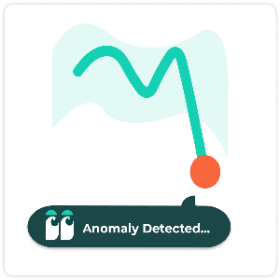
Anomaly Detection
por DataMa
Descubra anomalías en las líneas de tendencia de varias métricas y dimensiones al mismo tiempo

Globe Path
por LaDataViz
Muestre arcos dinámicos entre puntos de origen y destino en un globo terráqueo interactivo 3D

Circular Sankey Diagram
por Infotopics | Apps for Tableau
Muestra el flujo de una medida en diferentes dimensiones con bucles internos.
Tabla
por Actinvision
Un affichage sous forme de table simple et efficace pour vos données.

Marginal Histogram
por Infotopics | Apps for Tableau
Permita a los usuarios ver las distribuciones y relaciones entre variables en una sola vista

Assess Significance
por DataMa
Evalúe rápidamente la importancia estadística de las diferencias en los KPI entre dos puntos.
ProcessMining Free
por Infotopics | Apps for Tableau
Visualice y analice sus procesos basándose en las extracciones de archivos de registro

Funnel Chart
por Infotopics | Apps for Tableau
Flexible funnel small multiples for stage progression, conversion, grouping, and target tracking.
Bullet
por Actinvision
La extensión de gráfico de bala totalmente personalizable de Actinvision
WriteBackExtreme Free
por Infotopics | Apps for Tableau
Colabore directamente desde sus dashboards de Tableau con WriteBackExtreme.
Gauge chart
por Infotopics | Apps for Tableau
Show one or many KPI gauges with radial, speedometer, or traffic-light layouts.

Easy KPI Cards
por IP Faustov Aleksandr
Create beautiful, interactive KPI cards in Tableau — in seconds.

Calendar chart
por Infotopics | Apps for Tableau
Plot values by day in a calendar grid to reveal seasonality and temporal patterns.

Small Multiples
por Infotopics | Apps for Tableau
Repeat the same chart across panels to compare trends consistently and quickly.

Tree Diagram
por Infotopics | Apps for Tableau
Visualize hierarchical reporting structures with flexible layouts and node-level detail.

Area Bump
por LaDataViz
Visualize how rankings and category dominance change over time
Isotype
por Actinvision
Use imágenes para sacar información de sus datos

HierarchyFilter
por Infotopics | Apps for Tableau
Replace multiple dashboard filters with one intuitive hierarchy filter.

Streamgraph
por Infotopics | Apps for Tableau
Show changing composition over time with flowing, stacked series around a centerline.
Date Picker
por Actinvision
Céntrese en periodos concretos o compárelos con facilidad
Nightingale+
por Actinvision
Nightingale es una visualización circular diseñada para resaltar la magnitud relativa de las categorías

Horizon Chart
por Infotopics | Apps for Tableau
Compress long time-series into compact bands for dense trend comparison.
%20(1).png&w=256&q=75)
Dimensions & Metrics Explorer
por DataMa
This extension enables interactive KPI breakdowns with multi-dimensional, multi-metric views.

Tournament Bracket
por LaDataViz
Build stylish tournament-style bracket diagrams to follow the progression of your favorite team

Spreadsheet
por DataMa
Interact with your data in an Spreadsheet environment, as if you were in Excel or Google Sheet!
KPI Card
por Eduard Nizamov
KPI cards with built-in trend charts and automatic period comparison.

HierarchyFilter
por Infotopics | Apps for Tableau
Replace multiple dashboard filters with one intuitive hierarchy filter.

Waterfall
por LaDataViz
Create beautiful and modern Waterfall charts with running totals, subtotals, and targets
Error Bars
por Actinvision
The Error Chart displays values and uncertainties to visualize deviations and confidence intervals.
FinanceTables
por Infotopics | Apps for Tableau
IBCS-ready financial reporting, directly in Tableau.

Ternary Plot
por LaDataViz
Plot three-part data on an triangle to reveal how each mark splits across three categories