視覺效果擴充功能
功能
全部 視覺效果擴充功能

Sankey
依據 Tableau
Sankey 圖用於顯示多個類別之間的資料流程。

Tableau Table
依據 Tableau
直接在 Tableau 中透過條件式格式設定建立豐富的資料表體驗。

Radial
依據 Tableau
Displays data in a circular format in which the total of all segment values add up to 100%.

Donut
依據 LaDataViz
無需任何技巧即可建立環圈圖

Tree Diagram
依據 LaDataViz
建立漂亮的放射、水平或垂直樹狀圖

Gauge
依據 LaDataViz
透過一次拖放動作建立完全可自訂的量測計圖
SuperTables
依據 Infotopics | Apps for Tableau
可讓使用者分析和探索資料,以支援在精彩的互動表格中使用視覺效果。

Radar Chart
依據 Infotopics | Apps for Tableau
以二維圖表的形式顯示多變量資料的圖形方法
PowerKPIs
依據 Infotopics | Apps for Tableau
Integrieren Sie mit PowerKPIs strategische Erkenntnisse in Ihre Tableau Dashboards

Waterfall Chart
依據 Infotopics | Apps for Tableau
瀑布圖直觀地顯示了連續變化對起始值造成的累積效應。

KPI Card (BANs)
依據 LaDataViz
無需在單一工作表中進行任何計算即可建立令人驚嘆的 KPI 卡片
Sankey Diagram
依據 Infotopics | Apps for Tableau
高度可自訂的「Sankey 圖」,可跨多個維度視覺化度量流動。

Radar
依據 LaDataViz
使用我們精美的雷達圖擴充功能比較效能

Streamgraph
依據 LaDataViz
使用美觀且引人入勝的 Streamgraph 顯示時間序列資料
DrillDownTree
依據 Infotopics | Apps for Tableau
可跨多個維度視覺化和彙總資料 - 可以按任意順序向下鑽研。

Zoomable Sunburst
依據 Infotopics | Apps for Tableau
以放射配置呈現資料的階層視覺效果

Polar Area / Nightingale
依據 LaDataViz
使用極座標圓餅圖(也稱為 Coxcomb 圖或 Nightingale Rose 圖)完美比較維度
放射環狀(可縮放)
依據 Actinvision
放射環狀圖表用於使用同心圓來視覺化階層資料。

Network Diagram
依據 Infotopics | Apps for Tableau
高度可自訂的「網狀圖」,讓使用者理解資料中的關係。

Beeswarm
依據 LaDataViz
使用 Beeswarm 圖表顯示資料分佈
Heatmap
依據 Actinvision
熱度圖透過色彩變化來視覺化資料

Network
依據 LaDataViz
使用我們易於使用的網路擴充功能顯示複雜的關係

Line Chart
依據 LaDataViz
建立美觀現代的折線圖,支援多種樣式(曲線、面積、漸層)

Venn Diagram
依據 Infotopics | Apps for Tableau
用於說明資料集之間關係的圖形呈現。
雷達
依據 Actinvision
高度可自訂的雷達圖

Sankey - Draggable
依據 LaDataViz
建立精美 Sankey 圖並移動節點以建立完美配置
漏斗圖
依據 Actinvision
簡單且可自訂的漏斗圖。

Sunburst Diagram
依據 Infotopics | Apps for Tableau
透過一系列環顯示層次結構,這些環針對每個類別節點進行切片。

Voronoi Treemap
依據 LaDataViz
使用 Voronoi 樹狀圖來改變視覺化階層資料的方式!
Recursive Sankey Diagram
依據 Infotopics | Apps for Tableau
視覺化一組特定資料從其來源到目的地的流動。
星形圖
依據 Actinvision
星形圖表只是指在極座標平面上顯示的橫條圖。
DashPets
依據 Infotopics | Apps for Tableau
將資料轉換為一隻可愛貓咪、快樂狗狗或者酷酷的暴聾。篩選、互動、享受快樂!

Bump Chart
依據 LaDataViz
借助精美的凹圖貼圖,輕鬆追蹤排名變化。

Radial Sankey
依據 LaDataViz
以優雅的放射 Sankey 圖顯示源和目標之間的流程

Chord Diagram
依據 Infotopics | Apps for Tableau
說明網路或系統中實體之間的關係和連線。
PictureThis Free
依據 Infotopics | Apps for Tableau
PictureThis 擴充功能可幫助您根據資料建立動態圖像資料表/卡。

Drill Down Filter
依據 LaDataViz
兩分鐘內可在您的儀表板中新增進階下拉式篩選選單

Chord
依據 LaDataViz
使用我們的弦圖擴衝充功能輕鬆視覺化流程和連線
Waterfall & KPI Tree: What's driving my variations?
依據 DataMa
使用 Datama for Tableau 來了解 KPI 變化背後的原因
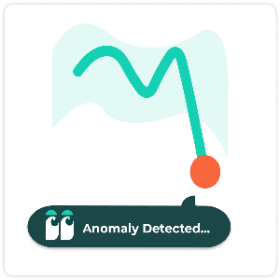
Anomaly Detection
依據 DataMa
為多個指標與維度同時找出趨勢線中的異常

Globe Path
依據 LaDataViz
在 3D 旋轉地球儀上顯示原點和目標點之間的動畫弧

Circular Sankey Diagram
依據 Infotopics | Apps for Tableau
透過內部循環視覺化多個維度上的度量流動。
資料表
依據 Actinvision
Un affichage sous forme de table simple et efficace pour vos données.

Marginal Histogram
依據 Infotopics | Apps for Tableau
使用者可在單一檢視中可視化變數的分佈與關係

Assess Significance
依據 DataMa
快速評估兩點之間任意 KPI 的統計學顯著差異。
ProcessMining Free
依據 Infotopics | Apps for Tableau
可根據記錄檔擷取視覺化和分析過程

Funnel Chart
依據 Infotopics | Apps for Tableau
Flexible funnel small multiples for stage progression, conversion, grouping, and target tracking.
Bullet
依據 Actinvision
Actinvision 的超級可自訂子彈圖擴充功能
WriteBackExtreme Free
依據 Infotopics | Apps for Tableau
使用 WriteBackExtreme 直接從 Tableau 儀表板進行協作。
Gauge chart
依據 Infotopics | Apps for Tableau
Show one or many KPI gauges with radial, speedometer, or traffic-light layouts.

Easy KPI Cards
依據 IP Faustov Aleksandr
Create beautiful, interactive KPI cards in Tableau — in seconds.

Calendar chart
依據 Infotopics | Apps for Tableau
Plot values by day in a calendar grid to reveal seasonality and temporal patterns.

Small Multiples
依據 Infotopics | Apps for Tableau
Repeat the same chart across panels to compare trends consistently and quickly.

Tree Diagram
依據 Infotopics | Apps for Tableau
Visualize hierarchical reporting structures with flexible layouts and node-level detail.

Area Bump
依據 LaDataViz
Visualize how rankings and category dominance change over time
Isotype
依據 Actinvision
使用影像讓資料說話

HierarchyFilter
依據 Infotopics | Apps for Tableau
Replace multiple dashboard filters with one intuitive hierarchy filter.

Streamgraph
依據 Infotopics | Apps for Tableau
Show changing composition over time with flowing, stacked series around a centerline.
Date Picker
依據 Actinvision
簡化聚焦特定時間段或比較不同時期的動作。
Nightingale+
依據 Actinvision
夜鶯是一個圓形的視覺效果,旨在醒目提示類別的相對大小

Horizon Chart
依據 Infotopics | Apps for Tableau
Compress long time-series into compact bands for dense trend comparison.
%20(1).png&w=256&q=75)
Dimensions & Metrics Explorer
依據 DataMa
This extension enables interactive KPI breakdowns with multi-dimensional, multi-metric views.

Tournament Bracket
依據 LaDataViz
Build stylish tournament-style bracket diagrams to follow the progression of your favorite team

Spreadsheet
依據 DataMa
Interact with your data in an Spreadsheet environment, as if you were in Excel or Google Sheet!
KPI Card
依據 Eduard Nizamov
KPI cards with built-in trend charts and automatic period comparison.

HierarchyFilter
依據 Infotopics | Apps for Tableau
Replace multiple dashboard filters with one intuitive hierarchy filter.

Waterfall
依據 LaDataViz
Create beautiful and modern Waterfall charts with running totals, subtotals, and targets
Error Bars
依據 Actinvision
The Error Chart displays values and uncertainties to visualize deviations and confidence intervals.
FinanceTables
依據 Infotopics | Apps for Tableau
IBCS-ready financial reporting, directly in Tableau.

Ternary Plot
依據 LaDataViz
Plot three-part data on an triangle to reveal how each mark splits across three categories