Radar 2.0
โดย LaDataViz
คำอธิบาย
ขอแนะนำ Radar Chart 2.0 สำหรับ Tableau
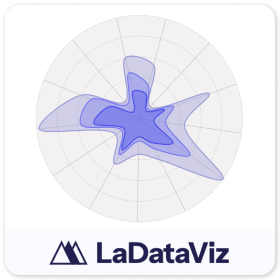
ยกระดับชุดเครื่องมือสร้างภาพข้อมูลด้วยส่วนขยาย Radar Chart สำหรับ Tableau ซึ่งออกแบบมาเพื่อนำเสนอมุมมองที่ครอบคลุมเกี่ยวกับข้อมูลหลายตัวแปร ส่วนขยายนี้ทำงานร่วมกับ Tableau ได้อย่างราบรื่นเพื่อสร้างแผนภูมิเรดาร์แบบละเอียด (หรือใยแมงมุม) ซึ่งเหมาะอย่างยิ่งสำหรับการเปรียบเทียบตัวแปรหลายตัวของกลุ่มตั้งแต่หนึ่งกลุ่มขึ้นไปภายในชุดข้อมูล
เวอร์ชันใหม่นี้เพิ่มประเภทของเครื่องหมายสีใหม่เพื่อให้คุณสามารถเลือกได้ระหว่างการแยกมุมมองด้วยรายละเอียดหรือการเพิ่มสี
ทำไมต้องใช้แผนภูมิเรดาร์ แผนภูมิเรดาร์มีประโยชน์อย่างยิ่งสำหรับการแสดงเมตริกประสิทธิภาพในหลายๆ ด้านในลักษณะที่เปรียบเทียบและแสดงความแตกต่างได้ง่าย แผนภูมินี้ช่วยให้ Viewer สามารถประเมินจุดแข็งและจุดอ่อนได้อย่างรวดเร็ว ซึ่งเหมาะสำหรับการเปรียบเทียบ การประเมินทักษะ หรือสถานการณ์ใดๆ ที่ต้องสรุปผลการปฏิบัติงานที่สัมพันธ์กันในหมวดหมู่ต่างๆ ด้วยภาพ
ฟีเจอร์ของส่วนขยาย Radar Chart:
- การเปรียบเทียบแบบหลายมิติข้อมูล: แสดงข้อมูลที่ครอบคลุมหลายตัวแปรในแผนภูมิเดียวที่เชื่อมโยงกัน ซึ่งง่ายต่อการเปรียบเทียบรายการหรือช่วงเวลาต่างๆ
- การสำรวจแบบอินเทอร์แอกทีฟ: ผู้ใช้สามารถโต้ตอบกับแผนภูมิเพื่อมุ่งเน้นไปที่จุดข้อมูลหรือเมตริกที่เฉพาะเจาะจง ซึ่งช่วยเพิ่มความเข้าใจผ่านความสามารถในการดูรายละเอียดแนวลึก
- การผสานรวมที่ราบรื่น: ออกแบบมาเพื่อให้เหมาะสำหรับสภาพแวดล้อม Tableau โดยยกระดับแดชบอร์ดของคุณด้วยความสามารถในการแสดงเป็นภาพขั้นสูง
- การออกแบบที่ปรับแต่งได้: แก้ไขแผนภูมิด้วยตัวเลือกสำหรับสี ขนาด และแกนเพื่อให้เหมาะกับความต้องการด้านการแสดงข้อมูลเป็นภาพเฉพาะของคุณ
เมื่อใช้ส่วนขยาย Radar Chart สำหรับ Tableau คุณจะสามารถแปลงข้อมูลที่ซับซ้อนและมีหลายมิติข้อมูลให้เป็นข้อมูลเชิงลึกที่เข้าใจได้ง่ายและนำไปปฏิบัติได้ เหมาะอย่างยิ่งสำหรับการตรวจสอบผลการปฏิบัติงานของแผนกทรัพยากรบุคคล การเปรียบเทียบผลิตภัณฑ์ หรือสถานการณ์การวิเคราะห์ใดๆ ที่ต้องการมุมมองแบบองค์รวมของตัวแปรหลายตัว เครื่องมือนี้จะช่วยทำให้ข้อมูลของคุณดูน่าสนใจและเป็นประโยชน์
อย่าพลาดการติดต่อกับเรา! เราส่งข้อมูลอัปเดตเกี่ยวกับส่วนขยาย Viz และเครื่องมืออื่นๆ ทุกสัปดาห์: https://newsletter.ladataviz.com/
- เว็บไซต์: https://www.ladataviz.com
- Twitter/X : https://twitter.com/ladataviz
- Youtube: https://www.youtube.com/@ladataviz
- LinkedIn: https://www.linkedin.com/in/ladataviz/
- ลิงก์อื่นๆทั้งหมด: https://linktr.ee/ladataviz
ข้อมูลจำเพาะทางเทคนิค
- โฮสต์ที่
- https://extensions.ladataviz.com/radar_v2?licenseKey=free
- ทำงานร่วมกับ
- Tableau เวอร์ชัน 2024.2 และใหม่กว่า
แหล่งข้อมูล
Download and start your free trial of Tableau today.
Try Tableau Now