Extensions de visualisation
Fonctionnalités
Galerie Extensions de visualisation

Sankey
par Tableau
Un diagramme de Sankey est utilisé pour afficher le flux de données entre plusieurs catégories.

Tableau Table
par Tableau
Créez une expérience de tables enrichie avec la mise en forme conditionnelle directement dans Tableau.

Radial
par Tableau
Displays data in a circular format in which the total of all segment values add up to 100%.

Donut
par LaDataViz
Créez un graphique en donut sans aucun hack

Tree Diagram
par LaDataViz
Créez de superbes diagramme en arborescence radiale, horizontale ou verticale

Gauge
par LaDataViz
Créez un graphique en jauge entièrement personnalisable par simple glisser-déposer
SuperTables
par Infotopics | Apps for Tableau
Donnez aux utilisateurs la possibilité d’analyser et de découvrir les données prenant en charge vos visuels dans ...

Radar Chart
par Infotopics | Apps for Tableau
Une méthode graphique permettant d’afficher des données multi-variables sous la forme d’un graphique 2D
PowerKPIs
par Infotopics | Apps for Tableau
# Integrieren Sie mit PowerKPIs strategische Erkenntnisse in Ihre Tableau-Dashboards

Waterfall Chart
par Infotopics | Apps for Tableau
Un graphique en cascade affiche sous forme visuelle l’effet cumulé de changements séquentiels sur une valeur de d...

KPI Card (BANs)
par LaDataViz
Créez une superbe fiche KPI sans calcul, dans une seule feuille de calcul !
Sankey Diagram
par Infotopics | Apps for Tableau
Diagramme de Sankey hautement personnalisable pour visualiser le flux d’une mesure à travers plusieurs dimensions.

Radar
par LaDataViz
Comparez les performances à l’aide de notre élégante extension Radar Chart

Streamgraph
par LaDataViz
Affichez les données chronologiques au moyen d’un Streamgraph aussi beau qu’intéressant
DrillDownTree
par Infotopics | Apps for Tableau
Visualisez et agrégez des données à travers plusieurs dimensions. Descendez dans la hiérarchie selon l’ordre de v...

Zoomable Sunburst
par Infotopics | Apps for Tableau
Une visualisation hiérarchique représentant des données dans une disposition radiale

Polar Area / Nightingale
par LaDataViz
Comparez des dimensions de manière élégante à l’aide d’un graphique en aire polaire (également appelé Coxcomb ou ...
Rayons de soleil (possibilité de zoomer)
par Actinvision
Le graphique en rayon de soleil est utilisé pour visualiser les données hiérarchiques à l’aide de cercles concent...

Network Diagram
par Infotopics | Apps for Tableau
Un diagramme en réseau hautement personnalisable qui permet aux utilisateurs de comprendre les relations au sein ...

Beeswarm
par LaDataViz
Affichez la distribution de vos données dans un graphique en essaim d’abeilles
Heatmap
par Actinvision
Les cartes de chaleur permettent de visualiser les données à travers les variations de couleur

Network
par LaDataViz
Affichez les relations complexes avec notre extension Network facile à utiliser

Venn Diagram
par Infotopics | Apps for Tableau
Une représentation graphique utilisée pour illustrer les relations entre des ensembles de données.

Line Chart
par LaDataViz
Créez des graphiques en courbe élégants et modernes avec plusieurs styles (courbes, aires, dégradés)
Radar
par Actinvision
Un graphique en radar hautement personnalisable

Sankey - Draggable
par LaDataViz
Créez de superbes diagramme de Sankey et déplacez les nœuds jusqu’à concevoir la disposition parfaite.
Entonnoir
par Actinvision
Un graphique en entonnoir simple et personnalisable.

Sunburst Diagram
par Infotopics | Apps for Tableau
Affiche la hiérarchie via une série d’anneaux qui sont découpés pour chaque nœud de catégorie.

Voronoi Treemap
par LaDataViz
Avec Voronoi Treemap, apportez une touche spéciale à la visualisation des données hiérarchiques.
Graphique radial
par Actinvision
Un graphique radial désigne simplement des graphiques à barres affichés sur des plans à coordonnées polaires.
Recursive Sankey Diagram
par Infotopics | Apps for Tableau
Visualise le flux d’un ensemble particulier de données depuis son origine vers sa destination.
DashPets
par Infotopics | Apps for Tableau
Transformez vos données en un adorable chat, un chien joyeux ou un T-Rex placide. Filtrez, interagissez et amusez...

Bump Chart
par LaDataViz
Repérez facilement les changements de classement à l’aide d’un étonnant graphique à bosses

Radial Sankey
par LaDataViz
Affichez le flux entre les sources et les cibles dans un élégant diagramme radial de Sankey

Chord Diagram
par Infotopics | Apps for Tableau
Illustrez les relations et les connexions entre les entités d’un réseau ou d’un système.
PictureThis Free
par Infotopics | Apps for Tableau
L’extension PictureThis vous permet de créer des tables/fiches d’images dynamiques basées sur vos données.

Drill Down Filter
par LaDataViz
Ajoutez un menu de filtre avancé à votre tableau de bord en deux minutes

Chord
par LaDataViz
Visualisez facilement les flux et les connexions avec notre extension Chord Diagram
Waterfall & KPI Tree: What's driving my variations?
par DataMa
Avec Datama pour Tableau, découvrez les raisons qui expliquent les variations de vos KPI.
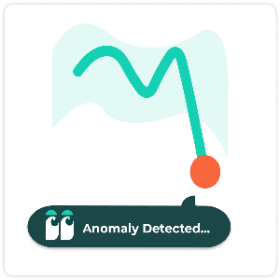
Anomaly Detection
par DataMa
Repérez les anomalies dans les courbes de tendance pour plusieurs métriques et dimensions en même temps

Globe Path
par LaDataViz
Affichez des arcs animés entre les points d’origine et de destination sur un globe 3D tournant.

Circular Sankey Diagram
par Infotopics | Apps for Tableau
Visualisez le flux d’une mesure à travers plusieurs dimensions avec des boucles internes.
Table
par Actinvision
Un affichage sous forme de table simple et efficace pour vos données.

Marginal Histogram
par Infotopics | Apps for Tableau
Permet aux utilisateurs de visualiser à la fois les distributions et les relations entre les variables dans une v...

Assess Significance
par DataMa
Évaluez rapidement l’importance statistique des différences pour tout KPI entre deux points.
ProcessMining Free
par Infotopics | Apps for Tableau
Visualisez et analysez vos processus sur la base d’extraits de fichiers journaux.
Bullet
par Actinvision
L’extension ultra personnalisable pour graphiques à puces d’Actinvision

Funnel Chart
par Infotopics | Apps for Tableau
Flexible funnel small multiples for stage progression, conversion, grouping, and target tracking.
WriteBackExtreme Free
par Infotopics | Apps for Tableau
Collaborez directement depuis vos tableaux de bord Tableau avec WriteBackExtreme.
Gauge chart
par Infotopics | Apps for Tableau
Show one or many KPI gauges with radial, speedometer, or traffic-light layouts.

Easy KPI Cards
par IP Faustov Aleksandr
Create beautiful, interactive KPI cards in Tableau — in seconds.

Calendar chart
par Infotopics | Apps for Tableau
Plot values by day in a calendar grid to reveal seasonality and temporal patterns.

Tree Diagram
par Infotopics | Apps for Tableau
Visualize hierarchical reporting structures with flexible layouts and node-level detail.

Small Multiples
par Infotopics | Apps for Tableau
Repeat the same chart across panels to compare trends consistently and quickly.

Area Bump
par LaDataViz
Visualize how rankings and category dominance change over time
Isotype
par Actinvision
Utilisez des images pour faire parler vos données

HierarchyFilter
par Infotopics | Apps for Tableau
Replace multiple dashboard filters with one intuitive hierarchy filter.
Date Picker
par Actinvision
Concentrez-vous sur des périodes spécifiques ou comparez différentes périodes en toute facilité
Nightingale+
par Actinvision
Nightingale est une visualisation circulaire conçue pour mettre en évidence la magnitude relative des catégories

Streamgraph
par Infotopics | Apps for Tableau
Show changing composition over time with flowing, stacked series around a centerline.

Horizon Chart
par Infotopics | Apps for Tableau
Compress long time-series into compact bands for dense trend comparison.
%20(1).png&w=256&q=75)
Dimensions & Metrics Explorer
par DataMa
This extension enables interactive KPI breakdowns with multi-dimensional, multi-metric views.

Tournament Bracket
par LaDataViz
Build stylish tournament-style bracket diagrams to follow the progression of your favorite team

Spreadsheet
par DataMa
Interact with your data in an Spreadsheet environment, as if you were in Excel or Google Sheet!
KPI Card
par Eduard Nizamov
KPI cards with built-in trend charts and automatic period comparison.

HierarchyFilter
par Infotopics | Apps for Tableau
Replace multiple dashboard filters with one intuitive hierarchy filter.
Error Bars
par Actinvision
The Error Chart displays values and uncertainties to visualize deviations and confidence intervals.
FinanceTables
par Infotopics | Apps for Tableau
IBCS-ready financial reporting, directly in Tableau.

Waterfall
par LaDataViz
Create beautiful and modern Waterfall charts with running totals, subtotals, and targets

Ternary Plot
par LaDataViz
Plot three-part data on an triangle to reveal how each mark splits across three categories