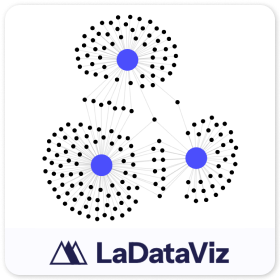
Network 2.0
por LaDataViz
Descripción
Presentación de la extensión Network para Tableau
Mejore sus análisis con la extensión Network Chart para Tableau, una herramienta de visualización completa diseñada para destacar las conexiones y relaciones dentro de sus datos. Esta extensión se integra sin problemas con Tableau, para que los usuarios puedan crear diagramas de red interactivos y detallados que muestren la estructura subyacente de sistemas complejos.
Network 2.0 incluye muchas novedades:
- Una nueva tarjeta Marcas de color para agregar color a la fuente, al destino o a ambos.
- La capacidad para usar un campo para establecer el tamaño de los enlaces
- La opción para usar diferentes campos para los tamaños de fuente y destino
¿Por qué debería usar gráficos de red? Los gráficos de red son muy útiles para explorar y presentar las relaciones entre entidades, ya sean personas de una red social, componentes de una infraestructura o elementos en estructuras de datos. Estos diagramas ofrecen un mapa visual de las interconexiones, lo que ayuda a los usuarios a comprender cómo interactúan los puntos de datos y cómo influyen unos en los otros.
Características de la extensión Network Chart:
- Visualización completa: muestre relaciones y estructuras de red complejas en un formato comprensible y atractivo visualmente.
- Interactividad dinámica: explore la red con funcionalidades como el zoom, el desplazamiento y los nodos interactivos, que permiten desglosar los detalles más concretos de las conexiones.
- Integración sin problemas: funciona a la perfección con el ecosistema de Tableau, lo que mejora sus dashboards actuales con capacidades de visualización de redes avanzadas.
- Personalización: ajuste el tamaño de los nodos, el grosor de los bordes, los colores y mucho más para ajustarse a la estética de su presentación o para destacar aspectos concretos de sus datos.
Es idónea para analistas de datos, investigadores y profesionales de la inteligencia de negocios, ya que proporciona información detallada sobre las dinámicas de las relaciones, lo que ayuda a tomar decisiones estratégicas basadas en pruebas visuales completas.
Sigamos en contacto: enviamos novedades semanales sobre las extensiones de visualizaciones y otras herramientas: https://newsletter.ladataviz.com/
- Sitio web: https://www.ladataviz.com
- Twitter/X : https://twitter.com/ladataviz
- Youtube: https://www.youtube.com/@ladataviz
- LinkedIn: https://www.linkedin.com/in/ladataviz/
- Otros enlaces: https://linktr.ee/ladataviz
Especificaciones tecnológicas
- Hospedado en
- https://extensions.ladataviz.com/network_v2?licenseKey=free
- Funciona con
- Tableau 2024.2 y posteriores
Recursos
Download and start your free trial of Tableau today.
Try Tableau NowMás de LaDataViz
.png&w=256&q=75)
Sankey - Draggable
por LaDataViz
Cree diagramas de Sankey atractivos y mueva los nodos para crear un diseño perfecto.
Tree Diagram 2.0
por LaDataViz
Transforme sus datos en diagramas de árbol completos radiales, horizontales o verticales.
Donut
por LaDataViz
Cree un gráfico de Donut sin esfuerzo.
Radar 2.0
por LaDataViz
Cree un gráfico de radar de diseño y repleto de información en segundos
Tree Diagram
por LaDataViz
Transforme sus datos en diagramas de árbol completos radiales, horizontales o verticales.
Drill Down Filter - Demo
por LaDataViz
Agregue un menú de filtro desplegable avanzado a su dashboard en un par de minutos
Polar Area Chart
por LaDataViz
Transforme sus datos en un gráfico de áreas polares perfecto y lleno de información (Coxcomb / Nightingale Rose)

Bump Chart
por LaDataViz
Transforme sus datos en un gráfico bump chart perfecto y lleno de información.
Voronoi Treemap
por LaDataViz
Transforme sus datos en un diagrama de árbol de Voronoi perfecto y lleno de información.

Chord Diagram
por LaDataViz
Transforme sus datos en un diagrama de cuerdas perfecto y lleno de información.
Radar
por LaDataViz
Transforme sus datos en un gráfico de radar perfecto y lleno de información.
Gauge
por LaDataViz
Transforme sus datos en un gráfico de velocímetro perfecto y lleno de información.

Beeswarm
por LaDataViz
Transforme sus datos en un enjambre perfecto y lleno de información.
Streamgraph
por LaDataViz
Transforme sus datos en un gráfico de flujo perfecto y lleno de información.
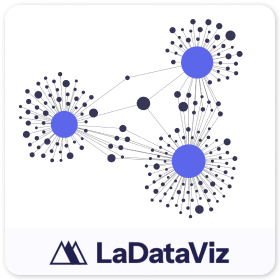
Network
por LaDataViz
Transforme sus datos en un diagrama de red perfecto y lleno de información.
Radial Sankey
por LaDataViz
Transforme sus datos en un diagrama de Sankey perfecto y lleno de información.