可视化项扩展程序
功能
所有 可视化项扩展程序

桑基图
按 Tableau
桑基图用于显示多个类别之间的数据流。

Tableau Table
按 Tableau
直接在 Tableau 中使用条件格式创建丰富的表格体验。

Radial
按 Tableau
Displays data in a circular format in which the total of all segment values add up to 100%.

Donut
按 LaDataViz
无需任何技巧便可创建圆环图

Tree Diagram
按 LaDataViz
创建美观的径向、水平或垂直树状图

Gauge
按 LaDataViz
只需一次拖放即可创建完全可自定义的仪表
SuperTables
按 Infotopics | Apps for Tableau
让用户分析和发现数据,在令人惊叹的交互式表格中支持您的视觉效果。

Radar Chart
按 Infotopics | Apps for Tableau
以二维图表的形式显示多元数据的图形方法
PowerKPIs
按 Infotopics | Apps for Tableau
Integrieren Sie mit PowerKPIs strategische Erkenntnisse in Ihre Tableau Dashboards

Waterfall Chart
按 Infotopics | Apps for Tableau
瀑布图直观地显示了连续变化对起始值的累积影响。

KPI Card (BANs)
按 LaDataViz
在单个工作表中创建一个令人惊叹的 KPI 卡,无需任何计算
Sankey Diagram
按 Infotopics | Apps for Tableau
高度可定制的 Sankey Diagram,用于在多个维度上可视化度量流程。

Radar
按 LaDataViz
使用我们美观的 Radat Chart 扩展程序比较 绩效

Streamgraph
按 LaDataViz
使用美观迷人的量化波形图显示时间序列数据
DrillDownTree
按 Infotopics | Apps for Tableau
跨多个维度可视化和聚合数据 - 以任何顺序向下钻取。

Zoomable Sunburst
按 Infotopics | Apps for Tableau
以放射状布局表示数据的分层可视化项

Polar Area / Nightingale
按 LaDataViz
用极区图(也称为鸡冠花图或南丁格尔玫瑰图)美观地比较维度
旭日图(可缩放)
按 Actinvision
旭日图用于使用同心圆来可视化分层数据。

Network Diagram
按 Infotopics | Apps for Tableau
高度可自定义的 Network Diagram,允许用户了解数据中的关系。

Beeswarm
按 LaDataViz
使用 Beeswarm 图表显示数据的分布
Heatmap
按 Actinvision
热图通过颜色的变化将数据可视化

Network
按 LaDataViz
使用我们易于使用的 Network 扩展程序显示复杂的关系

Line Chart
按 LaDataViz
创建具有多种样式(曲线、面积、渐变)的美观而现代的折线图

Venn Diagram
按 Infotopics | Apps for Tableau
用于说明数据集之间关系的图形表示形式。
雷达
按 Actinvision
高度可定制的雷达图

Sankey - Draggable
按 LaDataViz
创建美观的桑基图并移动节点来创建完美布局
漏斗
按 Actinvision
一个简单且可定制的漏斗图。

Sunburst Diagram
按 Infotopics | Apps for Tableau
通过一系列环显示层次结构,这些环针对每个类别节点进行切片。

Voronoi Treemap
按 LaDataViz
用 Voronoi 树形图来改变您可视化分层数据的方式!
Recursive Sankey Diagram
按 Infotopics | Apps for Tableau
可视化特定数据集从其源到其目的地的流动。
径向图
按 Actinvision
径向图仅指在极坐标平面上显示的条形图。
DashPets
按 Infotopics | Apps for Tableau
将数据转换成可爱的猫、快乐的狗或酷酷的霸王龙。筛选,互动,玩的开心!

Bump Chart
按 LaDataViz
使用令人惊叹的凹凸图轻松跟踪排名变化

Radial Sankey
按 LaDataViz
以优雅的放射状桑基图显示源和目标之间的流动

Chord Diagram
按 Infotopics | Apps for Tableau
说明网络或系统中实体之间的关系和连接。
PictureThis Free
按 Infotopics | Apps for Tableau
PictureThis 扩展程序可帮助您根据数据创建动态图像表/卡。

Drill Down Filter
按 LaDataViz
在两分钟内将高级下拉筛选器菜单添加到您的仪表板

Chord
按 LaDataViz
使用我们的 Chord Diagram 扩展程序,轻松可视化流程和连接
Waterfall & KPI Tree: What's driving my variations?
按 DataMa
使用 Datama for Tableau 了解 KPI 变化背后的原因
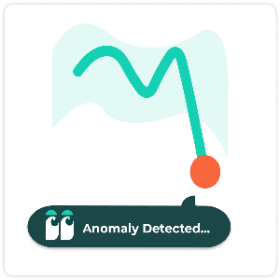
Anomaly Detection
按 DataMa
同时查找多个指标和维度的趋势线中的异常

Globe Path
按 LaDataViz
在 3D 旋转地球上显示起点和终点之间的动画弧线

Circular Sankey Diagram
按 Infotopics | Apps for Tableau
通过内部循环可视化多个维度上的度量流。
表
按 Actinvision
Un affichage sous forme de table simple et efficace pour vos données.

Marginal Histogram
按 Infotopics | Apps for Tableau
允许用户在单个视图中可视化变量之间的分布和关系

Assess Significance
按 DataMa
快速评估两点之间任何 KPI 差异的统计显著性。
ProcessMining Free
按 Infotopics | Apps for Tableau
基于日志文件数据提取来可视化和分析您的流程

Funnel Chart
按 Infotopics | Apps for Tableau
Flexible funnel small multiples for stage progression, conversion, grouping, and target tracking.
Bullet
按 Actinvision
ActinVision 的超级可定制项目符号图表扩展程序
WriteBackExtreme Free
按 Infotopics | Apps for Tableau
使用 WriteBackExtreme 直接从 Tableau 仪表板进行协作。
Gauge chart
按 Infotopics | Apps for Tableau
Show one or many KPI gauges with radial, speedometer, or traffic-light layouts.

Easy KPI Cards
按 IP Faustov Aleksandr
Create beautiful, interactive KPI cards in Tableau — in seconds.

Calendar chart
按 Infotopics | Apps for Tableau
Plot values by day in a calendar grid to reveal seasonality and temporal patterns.

Small Multiples
按 Infotopics | Apps for Tableau
Repeat the same chart across panels to compare trends consistently and quickly.

Tree Diagram
按 Infotopics | Apps for Tableau
Visualize hierarchical reporting structures with flexible layouts and node-level detail.

Area Bump
按 LaDataViz
Visualize how rankings and category dominance change over time
Isotype
按 Actinvision
使用图像让您的数据说话

HierarchyFilter
按 Infotopics | Apps for Tableau
Replace multiple dashboard filters with one intuitive hierarchy filter.

Streamgraph
按 Infotopics | Apps for Tableau
Show changing composition over time with flowing, stacked series around a centerline.
Date Picker
按 Actinvision
让关注特定时间段或比较不同时期变得简单
Nightingale+
按 Actinvision
南丁格尔图是一个圆形的可视化项,旨在突出类别的相对重要性

Horizon Chart
按 Infotopics | Apps for Tableau
Compress long time-series into compact bands for dense trend comparison.
%20(1).png&w=256&q=75)
Dimensions & Metrics Explorer
按 DataMa
This extension enables interactive KPI breakdowns with multi-dimensional, multi-metric views.

Tournament Bracket
按 LaDataViz
Build stylish tournament-style bracket diagrams to follow the progression of your favorite team

Spreadsheet
按 DataMa
Interact with your data in an Spreadsheet environment, as if you were in Excel or Google Sheet!
KPI Card
按 Eduard Nizamov
KPI cards with built-in trend charts and automatic period comparison.

HierarchyFilter
按 Infotopics | Apps for Tableau
Replace multiple dashboard filters with one intuitive hierarchy filter.

Waterfall
按 LaDataViz
Create beautiful and modern Waterfall charts with running totals, subtotals, and targets
Error Bars
按 Actinvision
The Error Chart displays values and uncertainties to visualize deviations and confidence intervals.
FinanceTables
按 Infotopics | Apps for Tableau
IBCS-ready financial reporting, directly in Tableau.

Ternary Plot
按 LaDataViz
Plot three-part data on an triangle to reveal how each mark splits across three categories