Viz 拡張機能
機能
すべての Viz 拡張機能

サンキー
パブリッシャー: Tableau
サンキー ダイアグラムを使用して、複数のカテゴリー間のデータ フローを表示します。

Tableau Table
パブリッシャー: Tableau
Tableau 内で条件付き書式を直接使って、さまざまなテーブル操作を実現します。

Radial
パブリッシャー: Tableau
Displays data in a circular format in which the total of all segment values add up to 100%.

Donut
パブリッシャー: LaDataViz
複雑なテクニックを使用せずに、ドーナツ チャートを作成します

Tree Diagram
パブリッシャー: LaDataViz
放射状、水平方向、垂直方向の美しいツリー ダイアグラムを作成します

Gauge
パブリッシャー: LaDataViz
ドラッグ&ドロップ操作だけで、完全にカスタマイズ可能なゲージを作成できます。
SuperTables
パブリッシャー: Infotopics | Apps for Tableau
ユーザーはデータの分析や検出を行い、見栄えのするインタラクティブな表のビジュアルをサポートすることができます。

Radar Chart
パブリッシャー: Infotopics | Apps for Tableau
多変量データを 2 次元グラフで表示するグラフィカルな方法
PowerKPIs
パブリッシャー: Infotopics | Apps for Tableau
Integrieren Sie mit PowerKPIs strategische Erkenntnisse in Ihre Tableau Dashboards

Waterfall Chart
パブリッシャー: Infotopics | Apps for Tableau
滝グラフは、開始値に対する連続的な変化の累積効果を視覚的に示します。

KPI Card (BANs)
パブリッシャー: LaDataViz
1 つのワークシートで計算なしで魅力的な KPI カードを作成できます
Sankey Diagram
パブリッシャー: Infotopics | Apps for Tableau
高度なカスタマイズが可能なサンキー ダイアグラムは、複数のディメンションにまたがってメジャーのフローを視覚化します。

Radar
パブリッシャー: LaDataViz
美しいレーダー チャート拡張機能を使用して、パフォーマンスを比較します

Streamgraph
パブリッシャー: LaDataViz
美しく魅力的なストリームグラフを使用して、時系列データを表示します
DrillDownTree
パブリッシャー: Infotopics | Apps for Tableau
複数のディメンションにまたがるデータのビジュアル化と集約 - 任意の順序でドリル ダウンします。

Zoomable Sunburst
パブリッシャー: Infotopics | Apps for Tableau
データを放射状のレイアウトで表示する階層的なビジュアライゼーション

Polar Area / Nightingale
パブリッシャー: LaDataViz
極域チャート (鳥頭図またはナイチンゲール ローズとも呼ばれる) を使用して、ディメンションを優れた視覚効果によって比較できます。
サンバースト図 (ズーム可能)
パブリッシャー: Actinvision
サンバースト図は、同心円を使用して階層データを視覚化するために使用されます。

Network Diagram
パブリッシャー: Infotopics | Apps for Tableau
高度なカスタマイズが可能なネットワーク ダイアグラムはユーザーがデータの関係を簡単に把握できるようにします。

Beeswarm
パブリッシャー: LaDataViz
蜂蜜プロットを使用して、データの分布を表示します
Heatmap
パブリッシャー: Actinvision
ヒートマップは色の変化を通じてデータを視覚化します

Network
パブリッシャー: LaDataViz
使いやすいネットワーク拡張機能を使用して、複雑な関係を表示します

Venn Diagram
パブリッシャー: Infotopics | Apps for Tableau
データ セット間の関係をグラフィカルに表現します。

Line Chart
パブリッシャー: LaDataViz
複数のスタイル (曲線、面、グラデーション) を使ってモダンで美しい折れ線グラフを作成します
レーダー
パブリッシャー: Actinvision
高度なカスタマイズが可能なレーダー チャート

Sankey - Draggable
パブリッシャー: LaDataViz
美しいサンキー ダイアグラムを作成し、ノードを動かして、完璧なレイアウトを作成しましょう
ファネル
パブリッシャー: Actinvision
シンプルでカスタマイズ可能なファネル チャート。

Sunburst Diagram
パブリッシャー: Infotopics | Apps for Tableau
各カテゴリ ノードにスライスされた一連のリングを使って階層を表示します。

Voronoi Treemap
パブリッシャー: LaDataViz
ボロノイ ツリーマップを使用して、階層的なデータの視覚化に変化を加えてみましょう。
円形チャート
パブリッシャー: Actinvision
円形チャートは、極座標面に表示される棒グラフのことを指します。
Recursive Sankey Diagram
パブリッシャー: Infotopics | Apps for Tableau
特定のデータ セットのオリジンから宛先までのフローを視覚化します。
DashPets
パブリッシャー: Infotopics | Apps for Tableau
データをかわいい猫、幸せな犬、かっこいい T-Rex に変換します。フィルタリングして、やりとりして、楽しんでください。

Bump Chart
パブリッシャー: LaDataViz
魅力的な順位推移グラフでランキングの変化を簡単に追跡します

Radial Sankey
パブリッシャー: LaDataViz
ソースとターゲット間のフローを洗練された放射状サンキー ダイアグラムで表示します

Chord Diagram
パブリッシャー: Infotopics | Apps for Tableau
ネットワークまたはシステムのエンティティ間の関係や接続を示します。
PictureThis Free
パブリッシャー: Infotopics | Apps for Tableau
PictureThis 拡張機能は、データに基づいて動的なイメージ テーブル/カードを作成するのに役立ちます。

Drill Down Filter
パブリッシャー: LaDataViz
高度なドロップダウン フィルター メニューを 2 分でダッシュボードに追加

Chord
パブリッシャー: LaDataViz
弦図拡張機能を使用すれば、フローと接続関係を簡単に視覚化できます
Waterfall & KPI Tree: What's driving my variations?
パブリッシャー: DataMa
Tableau 用の Datama で KPI バリエーションの背後にある理由を把握します
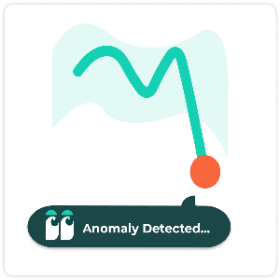
Anomaly Detection
パブリッシャー: DataMa
複数のメトリクスとディメンションの傾向線の異常を同時に見つけます

Globe Path
パブリッシャー: LaDataViz
3D 回転地球儀上で、起点と終点の間の弧線をアニメーションで描きます

Circular Sankey Diagram
パブリッシャー: Infotopics | Apps for Tableau
内部ループ内の複数のディメンションに対するメジャーのフローを視覚化します。
表
パブリッシャー: Actinvision
Un affichage sous forme de table simple et efficace pour vos données. (シンプルなテーブルを作成し、必要な機能を有効にします。)

Marginal Histogram
パブリッシャー: Infotopics | Apps for Tableau
単一のビューで変数の分布と変数間の関係を視覚化できるようにします

Assess Significance
パブリッシャー: DataMa
2 つのポイント間の KPI の差異に関する統計的有意性をすばやく評価します。
ProcessMining Free
パブリッシャー: Infotopics | Apps for Tableau
ログ ファイルの抽出に基づいてプロセスをビジュアル化して、分析します
Bullet
パブリッシャー: Actinvision
Actinvision の抜群のカスタマイズ性を備えたブレット グラフ拡張機能

Funnel Chart
パブリッシャー: Infotopics | Apps for Tableau
Flexible funnel small multiples for stage progression, conversion, grouping, and target tracking.
WriteBackExtreme Free
パブリッシャー: Infotopics | Apps for Tableau
WriteBackExtreme を使って、Tableau ダッシュボードから直接共同作業します。
Gauge chart
パブリッシャー: Infotopics | Apps for Tableau
Show one or many KPI gauges with radial, speedometer, or traffic-light layouts.

Easy KPI Cards
パブリッシャー: IP Faustov Aleksandr
Create beautiful, interactive KPI cards in Tableau — in seconds.

Calendar chart
パブリッシャー: Infotopics | Apps for Tableau
Plot values by day in a calendar grid to reveal seasonality and temporal patterns.

Tree Diagram
パブリッシャー: Infotopics | Apps for Tableau
Visualize hierarchical reporting structures with flexible layouts and node-level detail.

Small Multiples
パブリッシャー: Infotopics | Apps for Tableau
Repeat the same chart across panels to compare trends consistently and quickly.

Area Bump
パブリッシャー: LaDataViz
Visualize how rankings and category dominance change over time
Isotype
パブリッシャー: Actinvision
画像を使用してデータを表現します

HierarchyFilter
パブリッシャー: Infotopics | Apps for Tableau
Replace multiple dashboard filters with one intuitive hierarchy filter.
Date Picker
パブリッシャー: Actinvision
特定のタイムフレームに焦点を合わせたり、さまざまな期間を比較したりすることが簡単になります
Nightingale+
パブリッシャー: Actinvision
ナイチンゲール チャートは、カテゴリの相対的な大きさを強調する円形の Viz です。

Streamgraph
パブリッシャー: Infotopics | Apps for Tableau
Show changing composition over time with flowing, stacked series around a centerline.

Horizon Chart
パブリッシャー: Infotopics | Apps for Tableau
Compress long time-series into compact bands for dense trend comparison.
%20(1).png&w=256&q=75)
Dimensions & Metrics Explorer
パブリッシャー: DataMa
This extension enables interactive KPI breakdowns with multi-dimensional, multi-metric views.

Tournament Bracket
パブリッシャー: LaDataViz
Build stylish tournament-style bracket diagrams to follow the progression of your favorite team

Spreadsheet
パブリッシャー: DataMa
Interact with your data in an Spreadsheet environment, as if you were in Excel or Google Sheet!

HierarchyFilter
パブリッシャー: Infotopics | Apps for Tableau
Replace multiple dashboard filters with one intuitive hierarchy filter.
KPI Card
パブリッシャー: Eduard Nizamov
KPI cards with built-in trend charts and automatic period comparison.
Error Bars
パブリッシャー: Actinvision
The Error Chart displays values and uncertainties to visualize deviations and confidence intervals.
FinanceTables
パブリッシャー: Infotopics | Apps for Tableau
IBCS-ready financial reporting, directly in Tableau.

Waterfall
パブリッシャー: LaDataViz
Create beautiful and modern Waterfall charts with running totals, subtotals, and targets

Ternary Plot
パブリッシャー: LaDataViz
Plot three-part data on an triangle to reveal how each mark splits across three categories