product_type_viz_extensions
IPG_featuresHeading
product_type_all
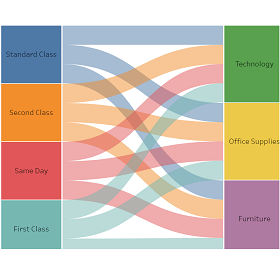
Sankey
product_byline
Sankey Diagram is used to show the flow of data between multiple categories.

Tree Diagram
product_byline
Transform your data into beautiful and insightful radial, horizontal or vertical Tree Diagrams.
SuperTables Free
product_byline
Let users analyse and discover the data to support your visuals in stunning interactive tables.

Streamgraph
product_byline
Transform your data into beautiful and insightful Streamgraphs.

Sunburst (zoomable)
product_byline
Le graphique en rayon de soleil affiche les données hiérarchiques à l’aide de cercles concentriques.
DashPets
product_byline
Transform data into a cute cat, happy dog, or cool T-Rex. Filter, interact, and have fun!
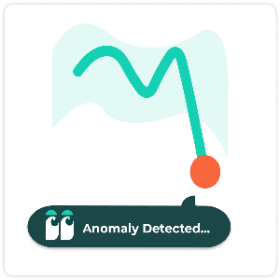
Anomaly Detection
product_byline
Effortlessly evaluate the normality of variations over time and explain it!

Tableau Table
product_byline
Create a rich table experience with conditional formatting directly in Tableau.

Bullet
product_byline
The ultra-customisable bullet chart extension from Actinvision

PowerKPIs
product_byline
Integrate strategic insights into your Tableau dashboards with PowerKPIs

Drill Down Filter - Demo
product_byline
Add an advanced drop-down filter menu to your Dashboard in two minutes

Polar Area Chart
product_byline
Transform your data into a beautiful and insightful Polar Area Chart (Coxcomb/Nightingale Rose)

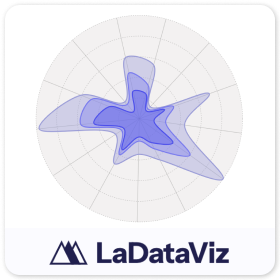
Radar Chart
product_byline
A graphical method of displaying multivariate data in the form of a two-dimensional chart
WriteBackExtreme Free
product_byline
Collaborate directly from your Tableau Dashboards with WriteBackExtreme.
Sankey Diagram
product_byline
Highly customisable Sankey Diagram to visualise flow of a measure across multiple dimensions.

Circular Sankey Diagram
product_byline
Visualise the flow of a measure over multiple dimensions with internal loops.
Recursive Sankey Diagram
product_byline
Visualises the flow of a particular set of data from its origin to its destination.

Zoomable Sunburst
product_byline
A hierarchical visualisation that represents data in a radial layout

Chord Diagram
product_byline
Illustrate the relationships and connections between entities in a network or system.

Waterfall Chart
product_byline
Helps in understanding the cumulative effect of sequentially introduced positive or negative values.

Network Diagram
product_byline
A highly customisable Network Diagram that allows users to understand relationships in data.

Sunburst Diagram
product_byline
Shows hierarchy through a series of rings that are sliced for each category node.

Venn Diagram
product_byline
A graphical representation used to illustrate the relationships between sets of data.

Table
product_byline
A simple performance-friendly table display for your data.

Radar
product_byline
A highly customisable Radar Chart

Funnel
product_byline
A simple yet customisable funnel chart
PictureThis Free
product_byline
The PictureThis extension helps you create dynamic image tables/cards based on your data.
ProcessMining Free
product_byline
Visualise and analyse your processes based on log file extractions
DrillDownTree Free
product_byline
Visualise and aggregate data across multiple dimensions – drill down in any order.

Bump Chart
product_byline
Transform your data into a beautiful and insightful Bump Chart.

Voronoi Treemap
product_byline
Transform your data into beautiful and insightful Voronoi Treemaps.

Chord Diagram
product_byline
Transform your data into beautiful and insightful Chord Diagrams.
Radar
product_byline
Transform your data into a beautiful and insightful Radar Chart.

Gauge
product_byline
Transform your data into a beautiful and insightful Gauge.
Waterfall & KPI Tree: What's driving my variations?
product_byline
Discover the WHY behind your KPIs variation with Datama for Tableau

Beeswarm
product_byline
Transform your data into beautiful and insightful Beeswarm.

Network
product_byline
Transform your data into a beautiful and insightful Network diagram.

Radial Sankey
product_byline
Transform your data into beautiful and insightful Radial Sankey.

Radial Chart
product_byline
The Radial Chart simply refers to bar charts displayed on polar coordinate planes.