product_type_viz_extensions
IPG_featuresHeading
product_type_all

Sankey
product_byline
Sankey Diagram is used to show the flow of data between multiple categories.

Tableau Table
product_byline
Create a rich table experience with conditional formatting directly in Tableau.

Radial
product_byline
Displays data in a circular format in which the total of all segment values add up to 100%.

Donut
product_byline
Create a Donut chart without any hacks

Tree Diagram
product_byline
Create beautiful radial, horizontal or vertical Tree Diagrams

Gauge
product_byline
Create a fully customisable Gauge with a single drag-and-drop
SuperTables
product_byline
Let users analyse and discover the data to support your visuals in stunning interactive tables.

Radar Chart
product_byline
A graphical method of displaying multivariate data in the form of a two-dimensional chart

Waterfall Chart
product_byline
A waterfall chart visually shows the cumulative effect of sequential changes on a starting value.
PowerKPIs
product_byline
Integrieren Sie mit PowerKPIs strategische Erkenntnisse in Ihre Tableau Dashboards

KPI Card (BANs)
product_byline
Create a stunning KPI Card without any calculations in a single worksheet
Sankey Diagram
product_byline
Highly customisable Sankey Diagram to visualise flow of a measure across multiple dimensions.

Radar
product_byline
Compare performances with our beautiful Radat Chart extension

Streamgraph
product_byline
Display time-series data with a beautiful and engaging Streamgraph
DrillDownTree
product_byline
Visualise and aggregate data across multiple dimensions – drill down in any order.

Zoomable Sunburst
product_byline
A hierarchical visualisation that represents data in a radial layout
Sunburst (zoomable)
product_byline
The Sunburst Diagram is used to visualise hierarchical data using concentric circles.

Polar Area / Nightingale
product_byline
Compare dimensions beautifully with a Polar Area chart (also called Coxcomb or Nightingale Rose)

Network Diagram
product_byline
A highly customisable Network Diagram that allows users to understand relationships in data.

Beeswarm
product_byline
Show the distribution of your data with a Beeswarm chart
Heatmap
product_byline
Heatmaps visualise data through variations in colouring

Network
product_byline
Display complex relationships with our easy-to-use Network extension

Venn Diagram
product_byline
A graphical representation used to illustrate the relationships between sets of data.
Radar
product_byline
A highly customisable radar chart
Funnel
product_byline
A simple and customisable Funnel Chart.

Line Chart
product_byline
Create beautiful and modern Line charts with multiple styles (curves, area, gradients)

Sankey - Draggable
product_byline
Create beautiful Sankey Diagrams and move the nodes around to create your perfect layout

Sunburst Diagram
product_byline
Shows hierarchy through a series of rings that are sliced for each category node.

Voronoi Treemap
product_byline
Give a twist to the way you visualise hierarchical data with a Voronoi Treemap!
Radial Chart
product_byline
A radial chart simply refers to bar charts displayed on polar coordinate planes.
Recursive Sankey Diagram
product_byline
Visualises the flow of a particular set of data from its origin to its destination.
DashPets
product_byline
Transform data into a cute cat, happy dog or cool T-Rex. Filter, interact and have fun!

Bump Chart
product_byline
Easily track the ranking changes with a stunning Bump chart

Radial Sankey
product_byline
Show the flow between sources and targets in an elegant Radial Sankey

Chord Diagram
product_byline
Illustrate the relationships and connections between entities in a network or system.
PictureThis Free
product_byline
The PictureThis extension helps you create dynamic image tables/cards based on your data.

Drill Down Filter
product_byline
Add an advanced drop-down filter menu to your Dashboard in two minutes

Chord
product_byline
Easily visualise flow and connections with our Chord Diagram extension
Waterfall & KPI Tree: What's driving my variations?
product_byline
Discover the WHY behind your KPIs variation with Datama for Tableau
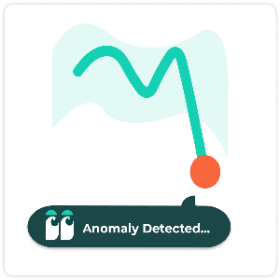
Anomaly Detection
product_byline
Find anomalies in trend lines for multiple metrics and dimensions at the same time

Circular Sankey Diagram
product_byline
Visualise the flow of a measure over multiple dimensions with internal loops.

Globe Path
product_byline
Display animated arcs between origin and destination points on a 3D spinning globe
Table
product_byline
Un affichage sous forme de table simple et efficace pour vos données.

Marginal Histogram
product_byline
Allow users to visualise both distributions and relationships between variables in a single view

Assess Significance
product_byline
Quickly assess the statistical significance of differences on any KPI between two points.
ProcessMining Free
product_byline
Visualise and analyse your processes based on log file extractions
Bullet
product_byline
The ultra-customisable bullet chart extension from Actinvision
WriteBackExtreme Free
product_byline
Collaborate directly from your Tableau Dashboards with WriteBackExtreme.

Funnel Chart
product_byline
Flexible funnel small multiples for stage progression, conversion, grouping, and target tracking.
Gauge chart
product_byline
Show one or many KPI gauges with radial, speedometer, or traffic-light layouts.
Isotype
product_byline
Use images to make your data talk

Easy KPI Cards
product_byline
Create beautiful, interactive KPI cards in Tableau — in seconds.

Calendar chart
product_byline
Plot values by day in a calendar grid to reveal seasonality and temporal patterns.

Tree Diagram
product_byline
Visualize hierarchical reporting structures with flexible layouts and node-level detail.

Area Bump
product_byline
Visualize how rankings and category dominance change over time

Small Multiples
product_byline
Repeat the same chart across panels to compare trends consistently and quickly.
Nightingale+
product_byline
The Nightingale is a circular viz designed to highlight the relative magnitude of categories
Date Picker
product_byline
Make it simple to focus on specific timeframes or compare different periods

HierarchyFilter
product_byline
Replace multiple dashboard filters with one intuitive hierarchy filter.

Streamgraph
product_byline
Show changing composition over time with flowing, stacked series around a centerline.

Horizon Chart
product_byline
Compress long time-series into compact bands for dense trend comparison.
%20(1).png&w=256&q=75)
Dimensions & Metrics Explorer
product_byline
This extension enables interactive KPI breakdowns with multi-dimensional, multi-metric views.

Tournament Bracket
product_byline
Build stylish tournament-style bracket diagrams to follow the progression of your favorite team

HierarchyFilter
product_byline
Replace multiple dashboard filters with one intuitive hierarchy filter.
Error Bars
product_byline
The Error Chart displays values and uncertainties to visualize deviations and confidence intervals.

Spreadsheet
product_byline
Interact with your data in an Spreadsheet environment, as if you were in Excel or Google Sheet!