Extensões de visualização
Recursos
Todos Extensões de visualização

Sankey
por Tableau
O Diagrama de Sankey é usado para mostrar o fluxo de dados entre várias categorias.

Tableau Table
por Tableau
Crie uma experiência de tabela rica com formatação condicional diretamente no Tableau.

Radial
por Tableau
Displays data in a circular format in which the total of all segment values add up to 100%.

Donut
por LaDataViz
Crie um gráfico de rosca sem nenhum truque

Tree Diagram
por LaDataViz
Crie belos diagramas de árvore radiais, horizontais ou verticais

Gauge
por LaDataViz
Crie um medidor totalmente personalizável com um único recurso de arrastar e soltar
SuperTables
por Infotopics | Apps for Tableau
Permita que os usuários analisem e descubram os dados para apoiar seus visuais em tabelas interativas impressiona...

Radar Chart
por Infotopics | Apps for Tableau
Um método gráfico de exibição de dados multivariados na forma de um gráfico bidimensional
PowerKPIs
por Infotopics | Apps for Tableau
Integrieren Sie mit PowerKPIs strategische Erkenntnisse in Ihre Tableau Dashboards

Waterfall Chart
por Infotopics | Apps for Tableau
Um gráfico em cascata mostra visualmente o efeito cumulativo de alterações sequenciais em um valor inicial.

KPI Card (BANs)
por LaDataViz
Crie um cartão de KPI impressionante sem nenhum cálculo em uma única planilha
Sankey Diagram
por Infotopics | Apps for Tableau
Diagrama de Sankey altamente personalizável para visualizar o fluxo de uma medida em múltiplas dimensões.

Radar
por LaDataViz
Compare desempenhos com nossa bela extensão Gráfico de radar

Streamgraph
por LaDataViz
Exiba dados de séries temporais com um Streamgraph bonito e envolvente
DrillDownTree
por Infotopics | Apps for Tableau
Visualize e agregue dados em várias dimensões – faça uma busca detalhada em qualquer ordem.

Zoomable Sunburst
por Infotopics | Apps for Tableau
Uma visualização hierárquica que representa dados em um layout radial

Polar Area / Nightingale
por LaDataViz
Compare dimensões de forma elegante com um gráfico de área polar (também chamado de Coxcomb ou Nightingale Rose).
Sunburst (zoomable)
por Actinvision
O Diagrama de Sunburst é usado para **visualizar dados hierárquicos usando círculos concêntricos**.

Network Diagram
por Infotopics | Apps for Tableau
Um diagrama de rede altamente personalizável que permite aos usuários compreender as relações nos dados.

Beeswarm
por LaDataViz
Mostre a distribuição dos seus dados com um gráfico Beeswarm
Heatmap
por Actinvision
Os mapas de calor visualizam dados por meio de variações de cores

Network
por LaDataViz
Exiba relacionamentos complexos com nossa extensão Rede fácil de usar

Venn Diagram
por Infotopics | Apps for Tableau
Uma representação gráfica usada para ilustrar as relações entre conjuntos de dados.

Line Chart
por LaDataViz
Crie gráficos de linhas modernos e atraentes usando diversos estilos (curvas, área, gradientes)
Radar
por Actinvision
Um gráfico de radar altamente personalizável

Sankey - Draggable
por LaDataViz
Crie lindos diagramas de Sankey e mova os nós para criar o layout perfeito
Funil
por Actinvision
Um gráfico de funil simples e personalizável.

Sunburst Diagram
por Infotopics | Apps for Tableau
Mostra a hierarquia através de uma série de anéis, que são fatiados para cada nó de categoria.

Voronoi Treemap
por LaDataViz
Dê um toque especial à forma como visualiza dados hierárquicos com um Mapa de árvore Voronoi!
Gráfico radial
por Actinvision
Um gráfico radial refere-se simplesmente aos gráficos de barras exibidos em planos de coordenadas polares.
Recursive Sankey Diagram
por Infotopics | Apps for Tableau
Visualiza o fluxo de um determinado conjunto de dados desde sua origem até seu destino.
DashPets
por Infotopics | Apps for Tableau
Transforme dados em um gato fofo, um cachorro feliz ou um T-Rex legal. Filtre, interaja e divirta-se!

Bump Chart
por LaDataViz
Acompanhe facilmente as mudanças no ranking com um gráfico de evolução impressionante

Radial Sankey
por LaDataViz
Mostre o fluxo entre origens e destinos em um elegante Radial Sankey

Chord Diagram
por Infotopics | Apps for Tableau
Ilustre os relacionamentos e conexões entre entidades em uma rede ou sistema.
PictureThis Free
por Infotopics | Apps for Tableau
The PictureThis extensão ajuda a criar tabelas/cartões de imagens dinâmicas com base em seus dados.

Drill Down Filter
por LaDataViz
Adicione um menu suspenso de filtro avançado ao seu painel em dois minutos

Chord
por LaDataViz
Visualize facilmente o fluxo e as conexões com nossa extensão Diagrama de acordes.
Waterfall & KPI Tree: What's driving my variations?
por DataMa
Descubra o PORQUÊ por trás da variação de seus KPIs com o Datama for Tableau
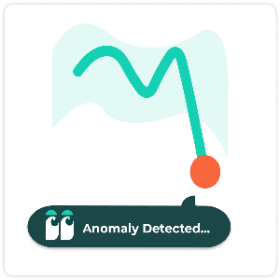
Anomaly Detection
por DataMa
Encontre anomalias em linhas de tendência para várias métricas e dimensões ao mesmo tempo

Globe Path
por LaDataViz
Exiba arcos animados entre os pontos de origem e destino em um globo giratório 3D

Circular Sankey Diagram
por Infotopics | Apps for Tableau
Visualiza o fluxo de uma medida em múltiplas dimensões com loops internos.
Tabela
por Actinvision
Un affichage sous forme de table simple et efficace pour vos données.

Marginal Histogram
por Infotopics | Apps for Tableau
Permitir que os usuários visualizem as distribuições e os relacionamentos entre as variáveis em uma única exibição

Assess Significance
por DataMa
Avalie rapidamente a significância estatística das diferenças em qualquer KPI entre dois pontos.
ProcessMining Free
por Infotopics | Apps for Tableau
Visualize e analise seus processos com base em extrações de arquivos de registro
Bullet
por Actinvision
A extensão de gráfico de marcador ultra personalizável da Actinvision

Funnel Chart
por Infotopics | Apps for Tableau
Flexible funnel small multiples for stage progression, conversion, grouping, and target tracking.
WriteBackExtreme Free
por Infotopics | Apps for Tableau
Colabore diretamente de seus painéis do Tableau com o WriteBackExtreme.
Gauge chart
por Infotopics | Apps for Tableau
Show one or many KPI gauges with radial, speedometer, or traffic-light layouts.

Easy KPI Cards
por IP Faustov Aleksandr
Create beautiful, interactive KPI cards in Tableau — in seconds.

Calendar chart
por Infotopics | Apps for Tableau
Plot values by day in a calendar grid to reveal seasonality and temporal patterns.

Tree Diagram
por Infotopics | Apps for Tableau
Visualize hierarchical reporting structures with flexible layouts and node-level detail.

Small Multiples
por Infotopics | Apps for Tableau
Repeat the same chart across panels to compare trends consistently and quickly.

Area Bump
por LaDataViz
Visualize how rankings and category dominance change over time
Isotype
por Actinvision
Use imagens para fazer seus dados falarem

HierarchyFilter
por Infotopics | Apps for Tableau
Replace multiple dashboard filters with one intuitive hierarchy filter.
Date Picker
por Actinvision
Faça com que seja fácil ter foco em períodos específicos ou comparar diferentes períodos

Streamgraph
por Infotopics | Apps for Tableau
Show changing composition over time with flowing, stacked series around a centerline.
Nightingale+
por Actinvision
O Nightingale é uma visualização circular projetada para destacar a magnitude relativa das categorias

Horizon Chart
por Infotopics | Apps for Tableau
Compress long time-series into compact bands for dense trend comparison.
%20(1).png&w=256&q=75)
Dimensions & Metrics Explorer
por DataMa
This extension enables interactive KPI breakdowns with multi-dimensional, multi-metric views.

Tournament Bracket
por LaDataViz
Build stylish tournament-style bracket diagrams to follow the progression of your favorite team

Spreadsheet
por DataMa
Interact with your data in an Spreadsheet environment, as if you were in Excel or Google Sheet!
KPI Card
por Eduard Nizamov
KPI cards with built-in trend charts and automatic period comparison.

HierarchyFilter
por Infotopics | Apps for Tableau
Replace multiple dashboard filters with one intuitive hierarchy filter.
Error Bars
por Actinvision
The Error Chart displays values and uncertainties to visualize deviations and confidence intervals.
FinanceTables
por Infotopics | Apps for Tableau
IBCS-ready financial reporting, directly in Tableau.

Waterfall
por LaDataViz
Create beautiful and modern Waterfall charts with running totals, subtotals, and targets

Ternary Plot
por LaDataViz
Plot three-part data on an triangle to reveal how each mark splits across three categories