

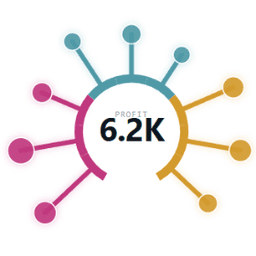
Radial Spike Chart
299c-表:by TableauOps|桜
eb7a-表:Free|桜
99e5-表:Description|桜
Radial Spike Chart turns a worksheet into a polar lollipop: one spike per item, spread evenly around a baseline arc that opens at the bottom. Each spike reaches outward in proportion to a measure, with an optional bubble at the tip area-sized by a second measure: two quantities per item, readable at a glance.
Encodings on the Marks card
- Item: one or more dimensions (up to 8 combined); one spike per value
- Length: how far each spike reaches from the arc
- Size (optional): area-sizes the bubble at the spike tip
- Colour (optional): paint spikes and bands the arc; measures get a continuous ramp, dimensions one colour per value
Built for real dashboards
- Clicking a spike selects the underlying marks, so filter and highlight actions fire like any native chart
- Hover shows a tooltip and a centre readout; the centre number features the largest mark by default
- Configure menu: mark colour with preset swatches, spike and bubble size, arc span (180–360°), sort order (group by colour, longest, shortest, as loaded), direction, label options and tip-bubble toggle – all saved with the workbook
- Fills its zone responsively, sheds labels and legend when small, never scrolls
Works entirely inside Tableau – no data leaves your browser, no sign-up required. Quick start with Superstore: Sub-Category → Item, SUM(Sales) → Length, SUM(Profit) → Size, Category → Colour.
e3b3-表:Tech Specifications|桜
- 86eb-表:Hosted at|桜
- https://ext.tableauops.com/u/tableauops/radial-spike/
- 73e6-表:Works with|桜
- 2214-表:Tableau 2024.2 and later|桜
6d57-表:Resources|桜
646a-表:Developer Website|桜bb6e-表:Privacy Policy|桜b8ff-表:Terms of Service|桜
Download and start your free trial of Tableau today.
Try Tableau Now