

Radial
299c-表:by Tableau|桜
eb7a-表:Free|桜
99e5-表:Description|桜
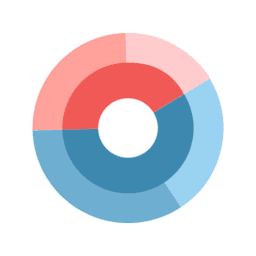
A radial chart displays data in a circular format in which the total of all segment values add up to 100%, representing the whole. This visualisation type creates donut charts, sunbursts and fan charts, which are powerful means to summarise simple part-to-whole insights at a high level. To learn more about what types of insights work best with a Radial, see Tableau Blog: Exploring Sankey and Radial Charts.
To build a viz with this extension, drag up to five dimensions on Ring and one measure on Angle.
This Viz Extension is created and hosted by Tableau and makes use of Tableau interactivity behaviours.
e3b3-表:Tech Specifications|桜
- 86eb-表:Hosted at|桜
- https://tableau-extensions.tableauusercontent.com/radial/radial.html
- 73e6-表:Works with|桜
- 2214-表:Tableau 2024.2 and later|桜
6d57-表:Resources|桜
646a-表:Developer Website|桜bb6e-表:Privacy Policy|桜b8ff-表:Terms of Service|桜
Download and start your free trial of Tableau today.
Try Tableau Now