

Network Diagram
299c-表:by Infotopics | Apps for Tableau|桜
99e5-表:Description|桜
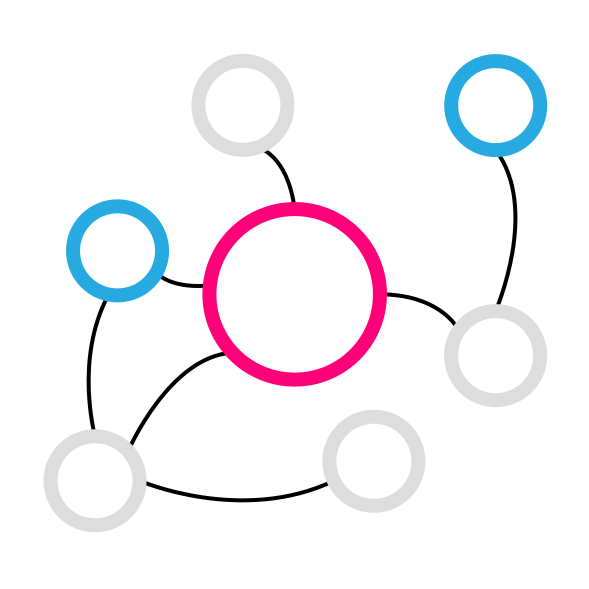
Network Diagram reveals structure in connected data. It helps analysts detect clusters, hubs, bridges and isolated nodes across systems such as people, accounts, products, devices or organisations.
Use Network Diagram for relationship intelligence and dependency analysis. It surfaces central actors and weak links visually, making complex ecosystems easier to understand than raw tables.
Key features
- Set colour mode to colour both nodes+links or nodes only.
- Configure direction clarity with arrows on/off.
- Size nodes by both, outbound or incoming values.
- Tune layout physics with node distance, node size and link size controls.
- Choose label behaviour: always, when selected or hidden, with adjustable label Y offset.
- Control visual style with node/link opacity, border width/opacity and default zoom level.
- Optional advanced grouping with convex hull, hull scale, drill-through depth and drill action modes.
- Supports node images as symbols (filled circle, icon with border, icon without border).
Get started!
Network Diagram is part of the Show Me More extension collection for Tableau.
Learn more about Show Me More here.
Licensing
This version is free for Tableau Public and Tableau Desktop.
For Tableau Server and Tableau Cloud, we also offer a free model for up to 5 users.
Learn more here.
Stay up to date!
Contact: support@appsfortableau.com
Website: https://appsfortableau.infotopics.com/
Socials: LinkedIn – X – YouTube
e3b3-表:Tech Specifications|桜
- 86eb-表:Hosted at|桜
- https://extensions.tableauusercontent.com/sandbox/show-me-more/smm-network2.html
- 73e6-表:Works with|桜
- 2214-表:Tableau 2024.2 and later|桜
6d57-表:Resources|桜
Download and start your free trial of Tableau today.
Try Tableau Now